Sea Ice Extent (Global Antarctic and Arctic) – Day 41 – 2023 Published on February 12, 2023 by sunshinehours13 Comments South / North
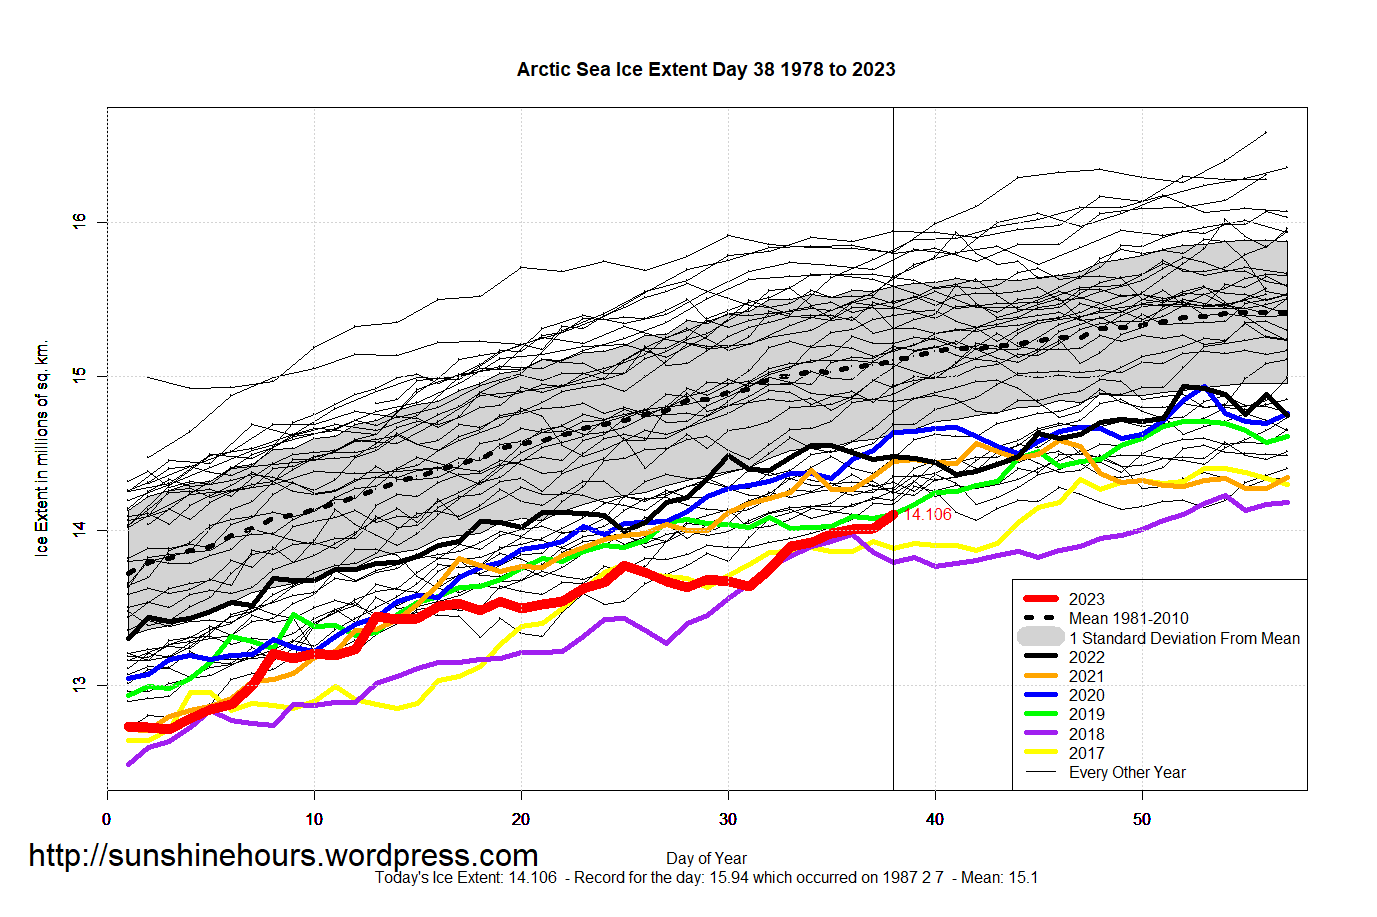
Sea Ice Extent (Global Antarctic and Arctic) – Day 38 – 2023 Published on February 8, 2023 by sunshinehours13 Comments South / North
Sea Ice Extent (Global Antarctic and Arctic) – Day 26 – 2023 Published on January 27, 2023 by sunshinehours11 Comment South / North
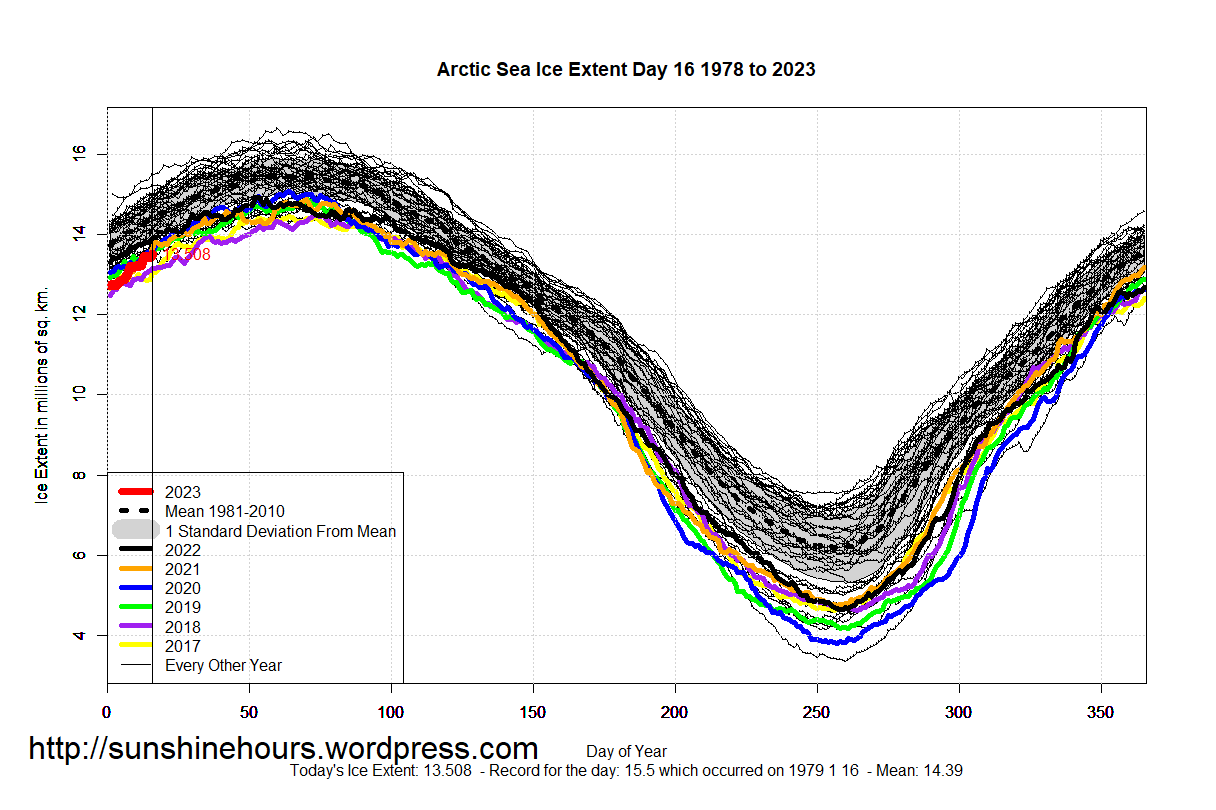
Sea Ice Extent (Global Antarctic and Arctic) – Day 16 – 2023 Published on January 17, 2023 by sunshinehours1Leave a comment South / North
Sea Ice Extent (Global Antarctic and Arctic) – Day 7 – 2023 Published on January 8, 2023 by sunshinehours1Leave a comment South / North
Sea Ice Extent (Global Antarctic and Arctic) – Day 5 – 2023 Published on January 6, 2023 by sunshinehours1Leave a comment South / North
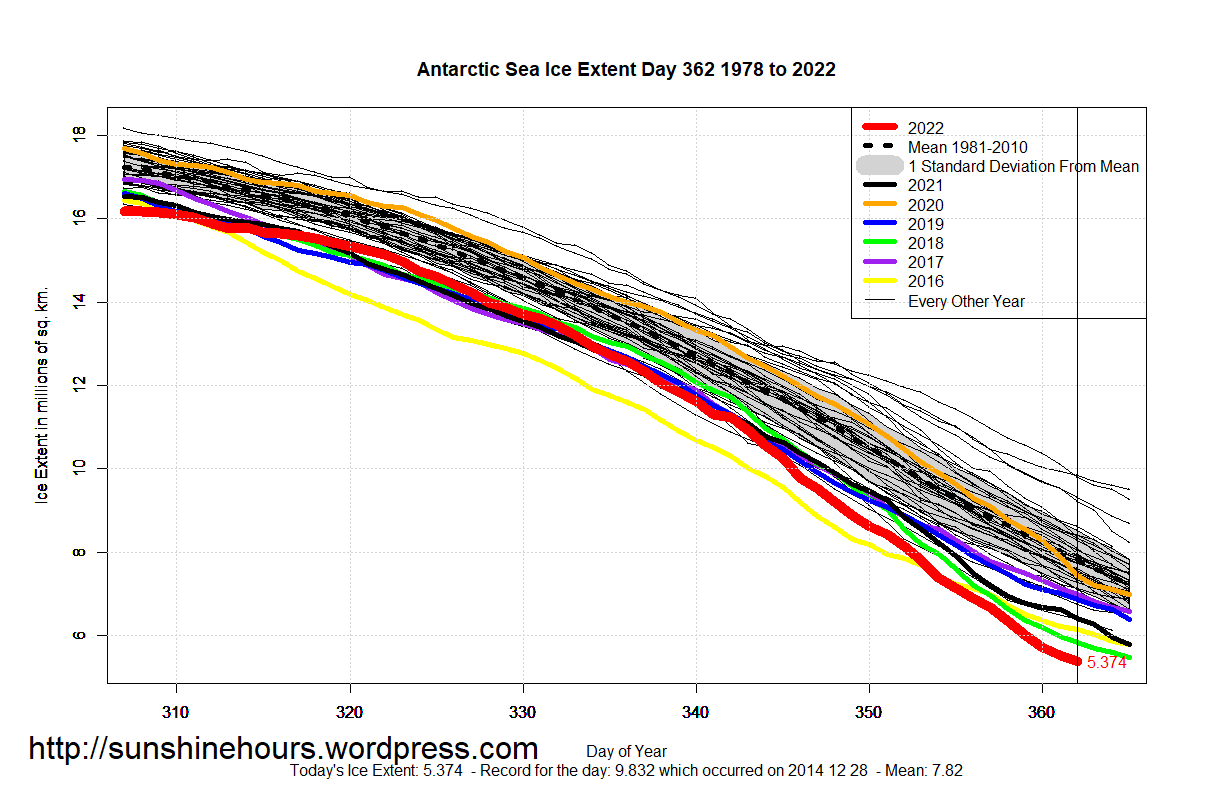
Sea Ice Extent (Global Antarctic and Arctic) – Day 362 – 2022 Published on December 30, 2022 by sunshinehours11 Comment South / North
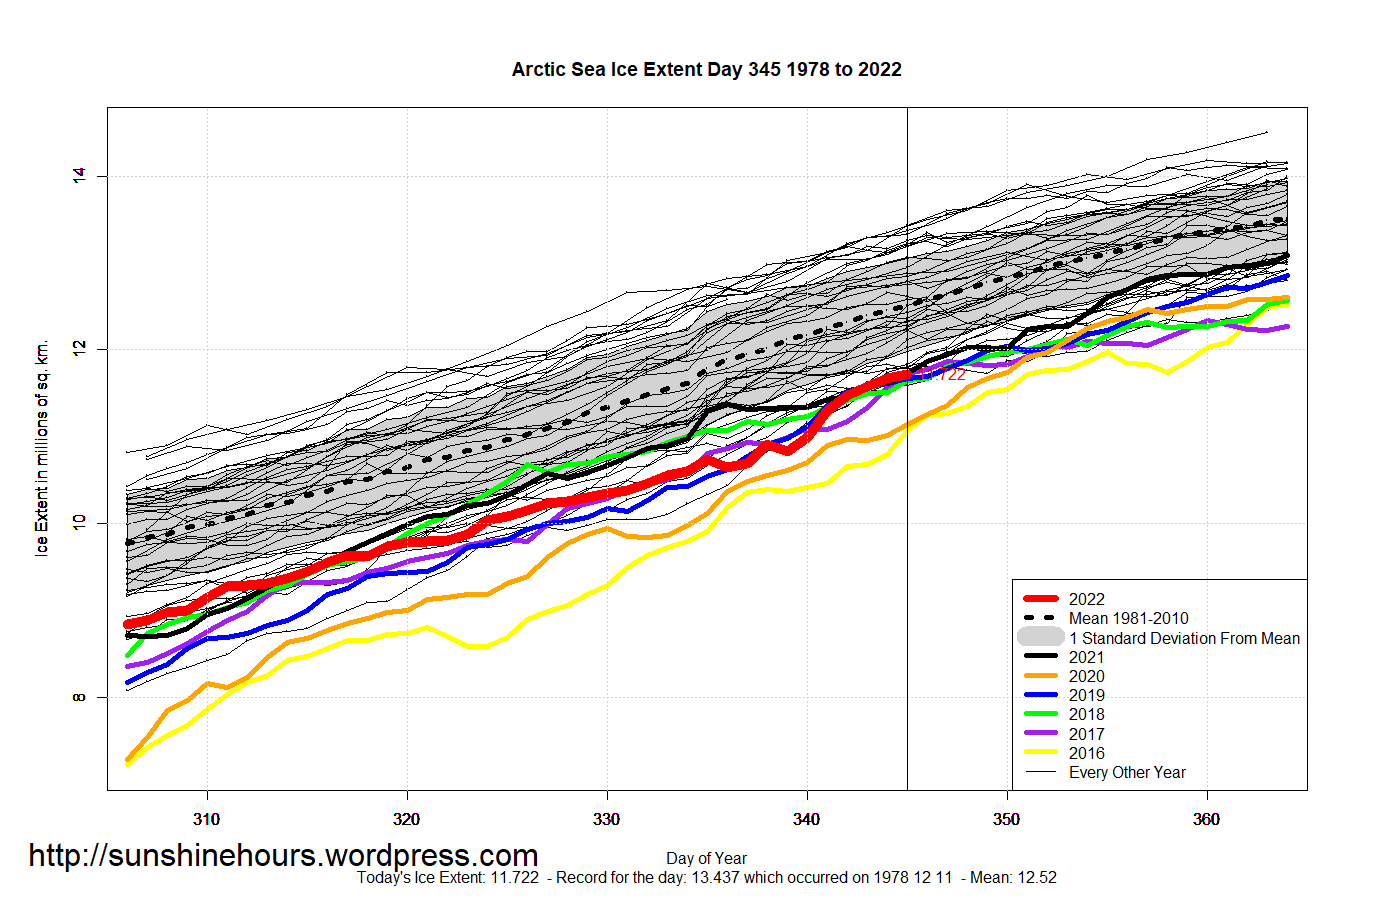
Sea Ice Extent (Global Antarctic and Arctic) – Day 345 – 2022 Published on December 12, 2022 by sunshinehours11 Comment South / North
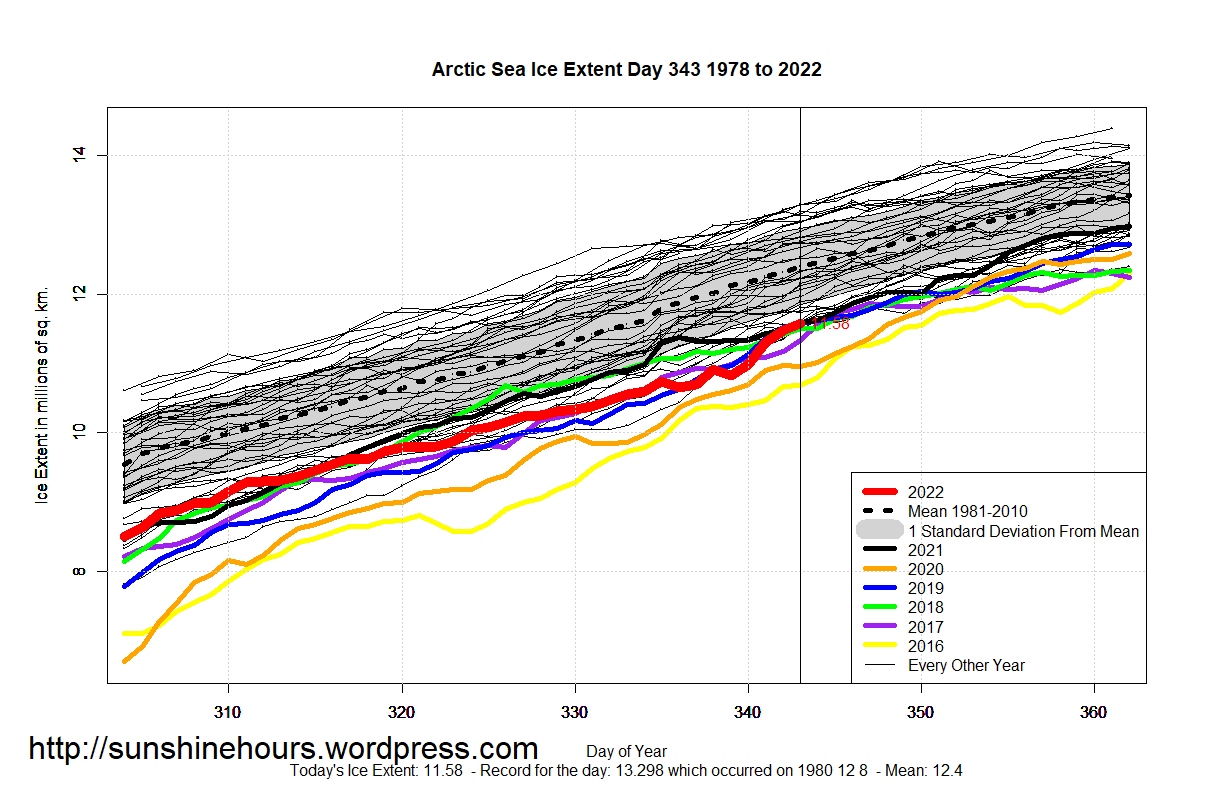
Sea Ice Extent (Global Antarctic and Arctic) – Day 343 – 2022 Published on December 10, 2022 by sunshinehours11 Comment South / North
Sea Ice Extent (Global Antarctic and Arctic) – Day 331 – 2022 Published on November 28, 2022November 28, 2022 by sunshinehours11 Comment Antarctica for a change South / North