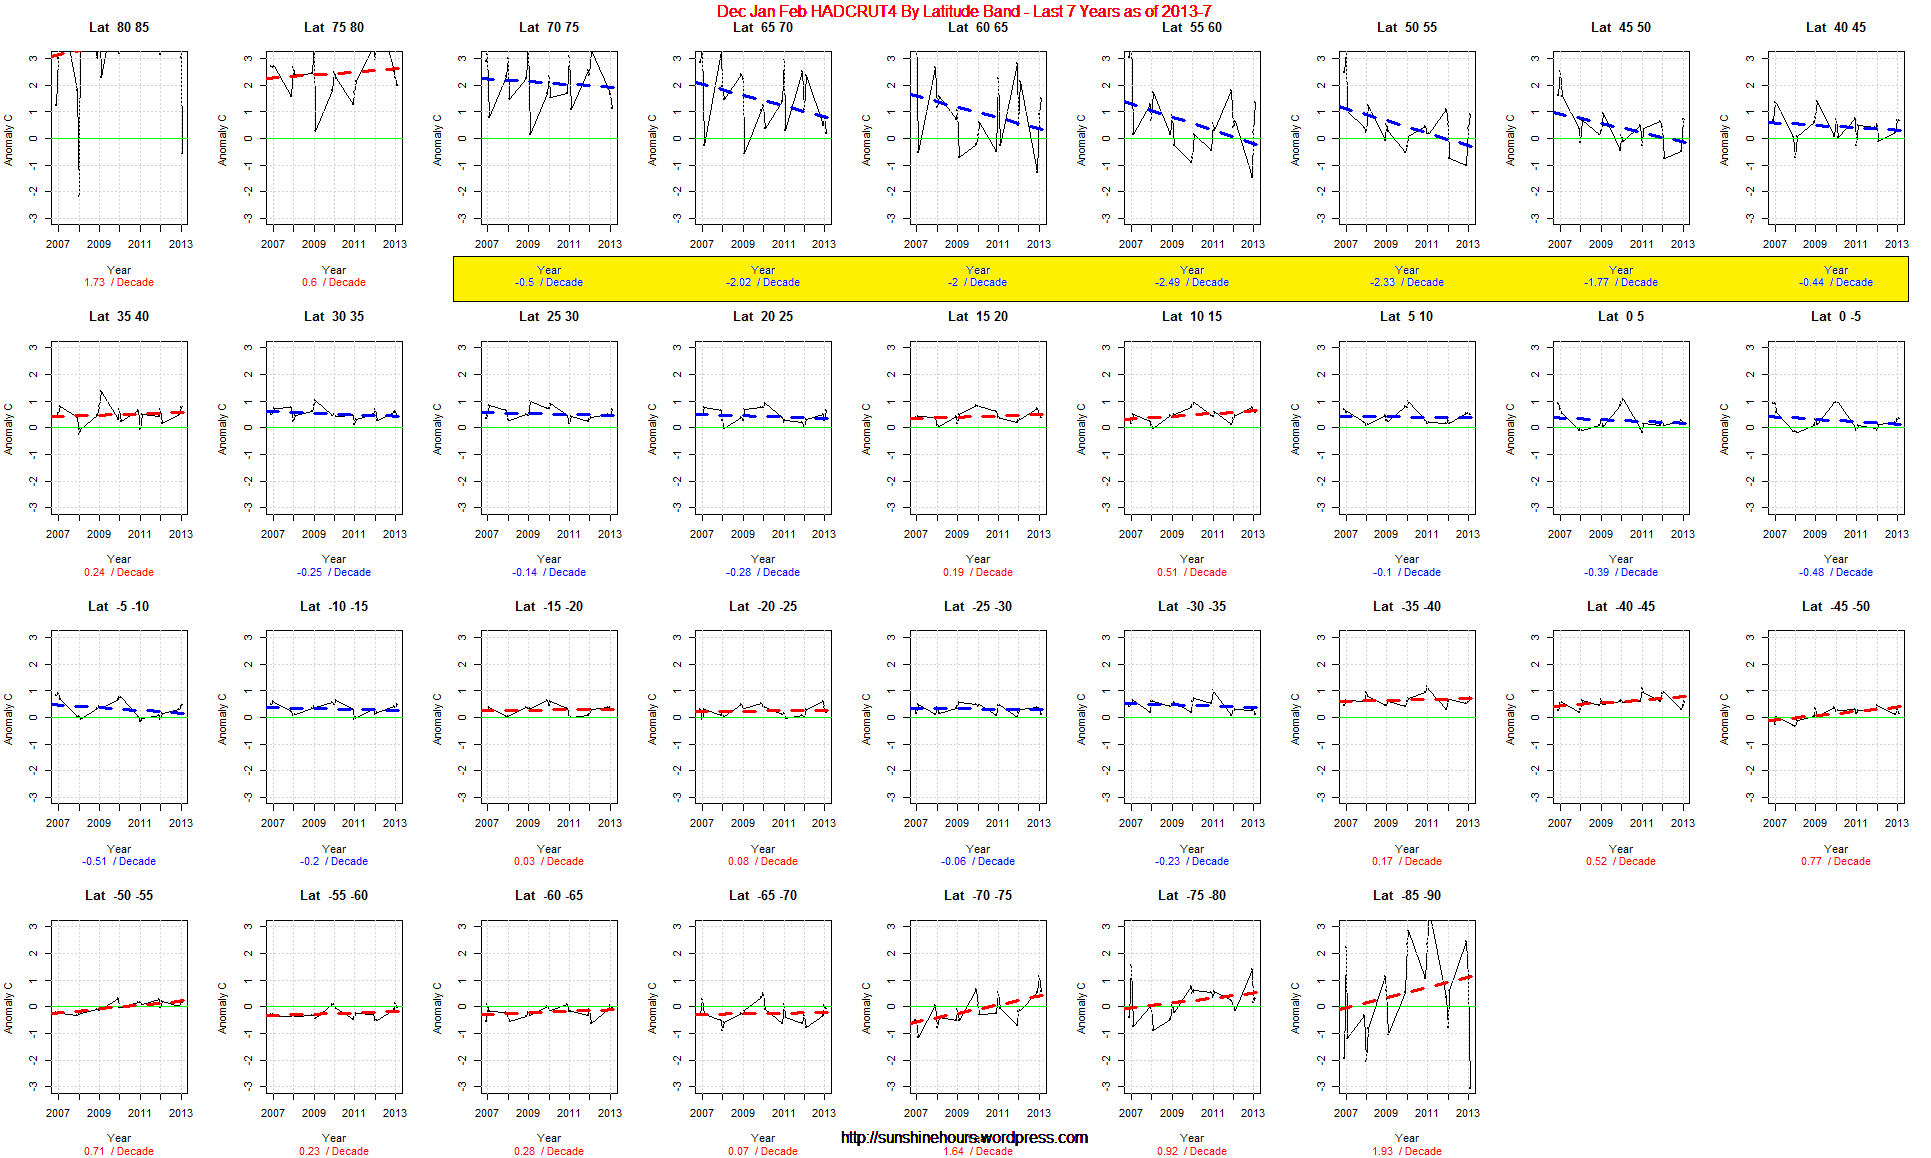
Winter temperatures in the Northern Hemisphere are dropping as much as 2.5C / decade over the last 7 years.
Yesterday my post was a look at the northern hemisphere by month over the last 7 years.
Today I am looking at the same time frame, but I am using the gridded HADCRUT4 data for Dec/Jan/Feb only. You will have to click on the image to get the full effect.
There are 7 latitude bands with yellow highlighting. The trend in those is from -.44C/decade to -2.49C/decade. And note the green 0 line. 0 is the 1961-1990 average, Anywhere the graph or trend crosses the green line it is colder than the 1961-1990 average. It was pretty cold in the 60s and 70s.
I wish I didn’t live in the 50th parallel.

TSI is the cause of the drop is my feeling.
Latest chart I can find on TSI..
http://www.woodfortrees.org/plot/pmod
Reconstructed TSI chart and info 1610 to 2010
http://lasp.colorado.edu/home/sorce/data/tsi-data/#summary_table
older chart Hansen did on TSI and N hem charts
http://hockeyschtick.blogspot.com/2013/07/hansen-1988-sun-controls-climate.html
Antarctica Sea Ice chart that is working.. Sea Ice way above mean.

Steve G posted it http://stevengoddard.wordpress.com/2013/10/14/understanding-record-antarctic-ice/
one more page on TSI
http://spot.colorado.edu/~koppg/TSI/