Over the last few days I have presented data for Arizona, Washington and Utah showing massive cooling trends in January for the last 15 years. I did something similar for HADCET last month.
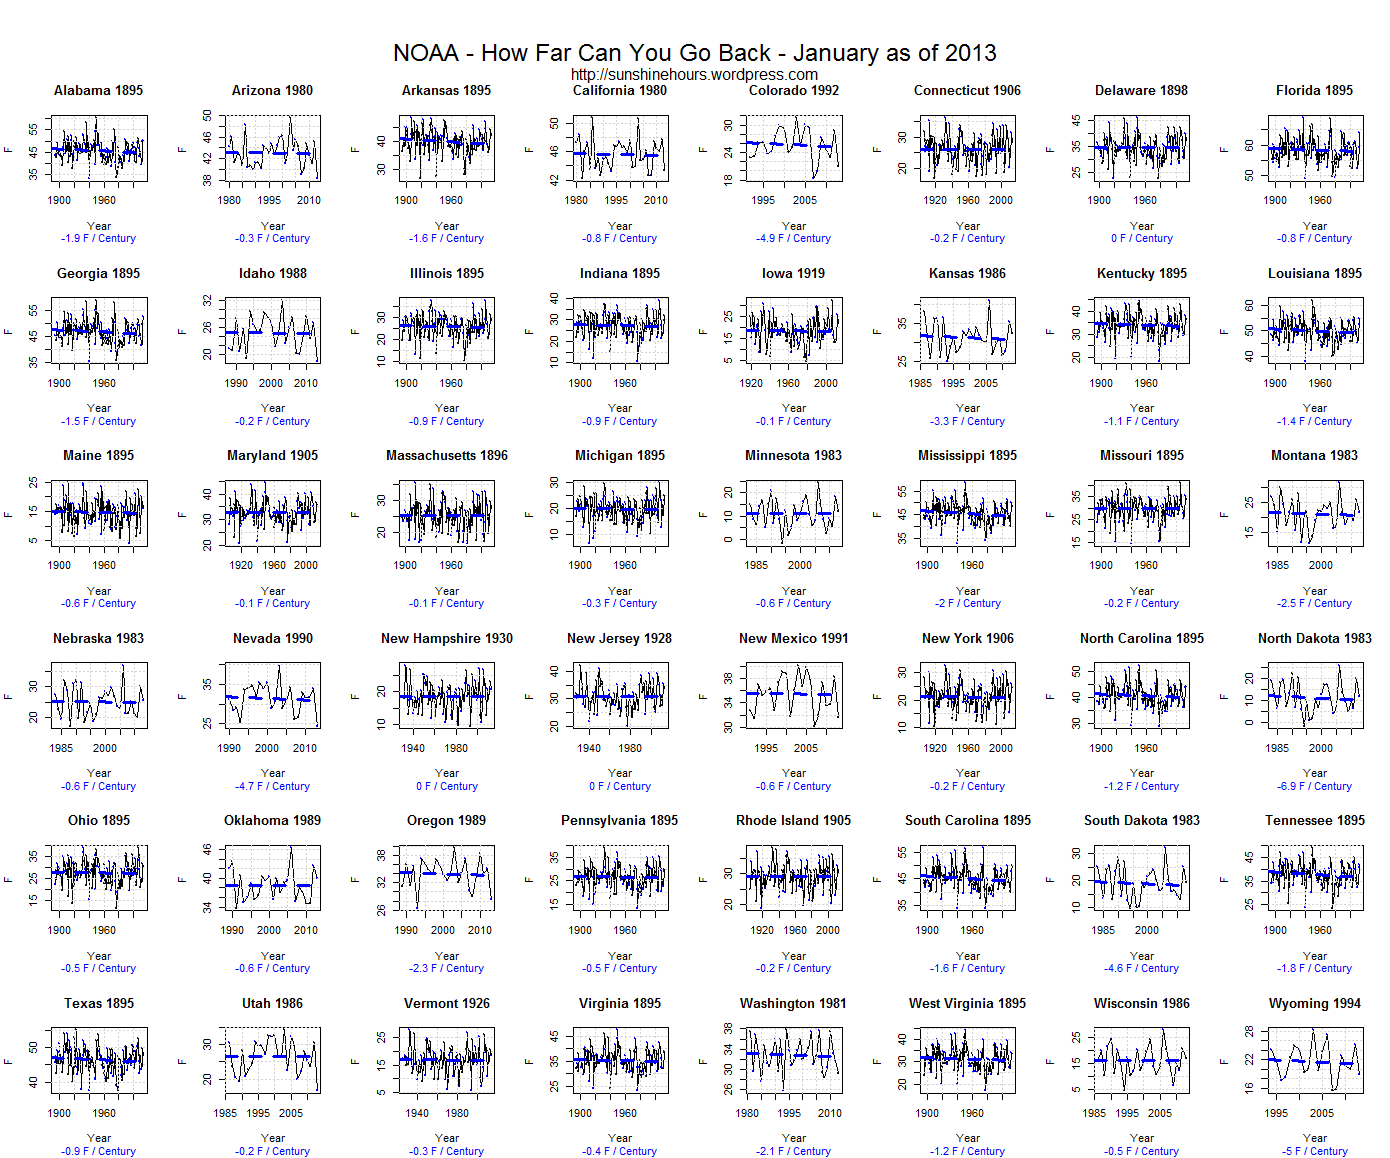
So I thought I would do the same “How Far Can You Go Back” for the lower 48 states for January. I was somewhat surprised. 20 states have a negative trend from 1895 (the beginning of the NOAA data).
Alabama in January (for example) is cooling at -1.9F/Century since 1895. You can check NOAA’s data here if you like. I did, just to make sure.
The top 6 cooling trends:
From 1983 North Dakota -6.919 F/Century
From 1994 Wyoming -4.992
From 1992 Colorado -4.862
From 1990 Nevada -4.704
From 1983 South Dakota -4.613
From 1986 Kansas -3.344
Click to make the graph bigger:
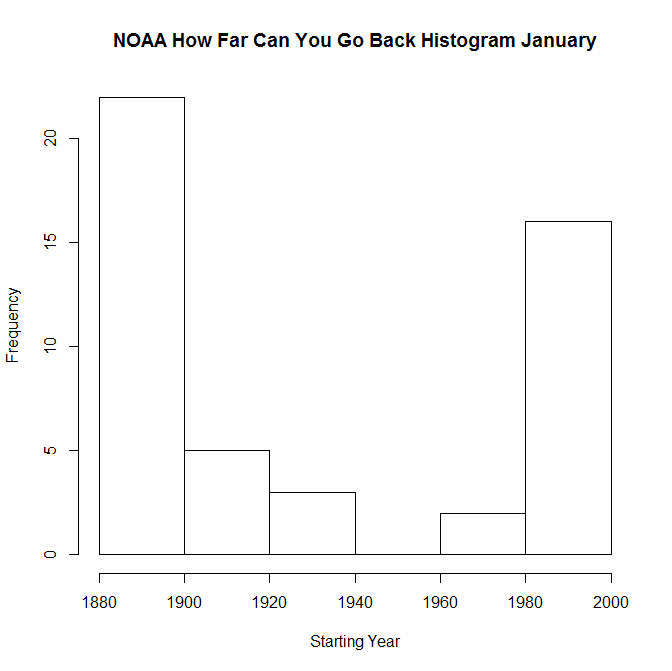
And the distribution:

You gotta watch out for NOAA NASA they have a tendency to cool the past. Just make sure you photograph ALL the graphs you’ve put up for future reference. Re Steven Goddard’s graphs showing massive “adjustive” fraud at those organizations. LOL
The “Real Scientists” need to get a mole into one of these gov. run agencies and get proof of the rampant fraud that is occurring there.
Very interesting data! Would be even more interesting to look at composite winter temps (Dec-Jan-Feb) to see the effect of the 1880–1915 cool period, the 1915-1945 warm period, the 1045-1977 cool period, the 1978-1998 warm period, and recent cooling.
Thanks. I plan to nibble away at the data. I am pretty fascinated how some states and some months don’t seem to show any CO2 signature.
In my research of British Columbia data, I’ve notice that January hasn’t changed much, December sure has.
The reason that “some states and some months don’t seem to show any CO2 signature” is that there isn’t any CO2 signature–I’ve got a computer full of data that shows a complete lack of any correlation between CO2 and temperature over time periods of years, centuries, and millennia.
Winters in the US over the past decade have been decidedly colder (as much as 8 degrees in most of the central US and 2-5 degrees closer to the coasts). That’s why a plot of Dec-Jan-Feb temps would be so interesting.
https://sunshinehours.wordpress.com/2013/11/18/noaa-winter-temperatures-by-state-from-1998-to-2013/
For a bunch of the states 2010 was the bottom for Winter temps and they have recovered somewhat. Others show no recovery.
All of the non-high elevation states have been dropping since the 1980s or before. The high elevation states of Colorado, Wyoming, Nevada, and New Mexico have only been dropping in January temperature since the early to mid 90s.
Excellent insight. I didn’t think about elevation.
I’m taking a bit of a break from blogging, but when I resume I will see about grouping by average elevation and then weighting by area/elevation and see what happens.