UPDATE: I am adding the following means:
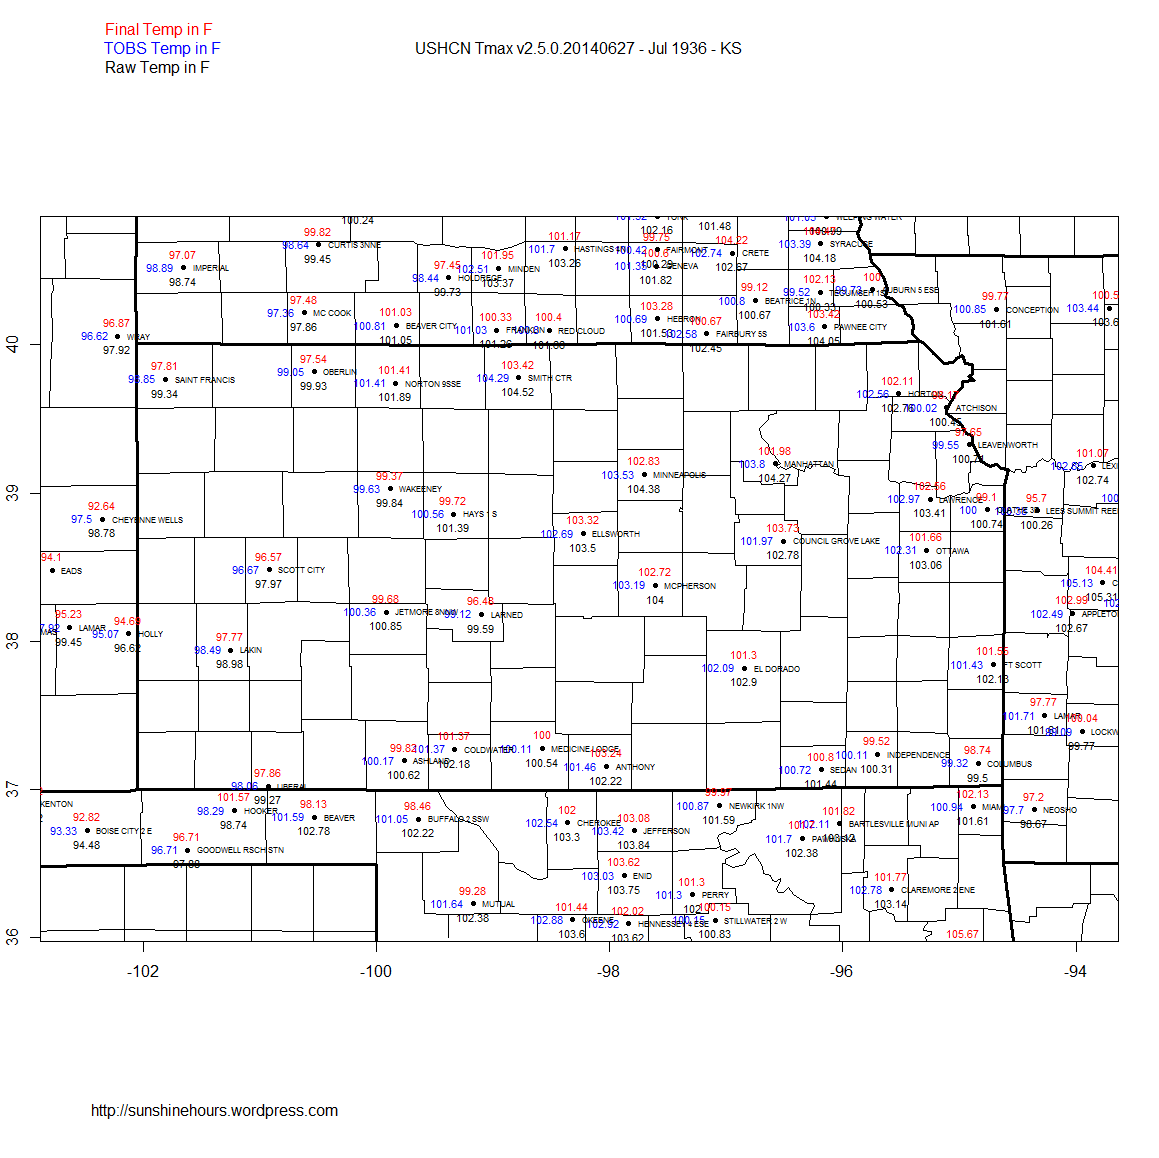
1936 raw / tobs / final mean = 101.47 / 100.83 / 100.32
2012 raw / tobs/ final mean = 99.57 / 99.66 / 99.48
Original Start of post:
I’ve been doing posts about USCHN and Estimated data. I wanted to visualize.
This is the USHCN July 1936 and 2012 TMAX data for Kansas.
Form the most part, in July 1936 the red data (Final) is colder than the raw temperatures (black) and in 2012 it is the other way around.
The data is in F (originally in C so there may be very slight conversion issues).
Black temperatures are raw, blue are TOBS and red are Final adjusted. Stations with just a red have no raw data. The data is just ‘E’stimated.
Click for full size.
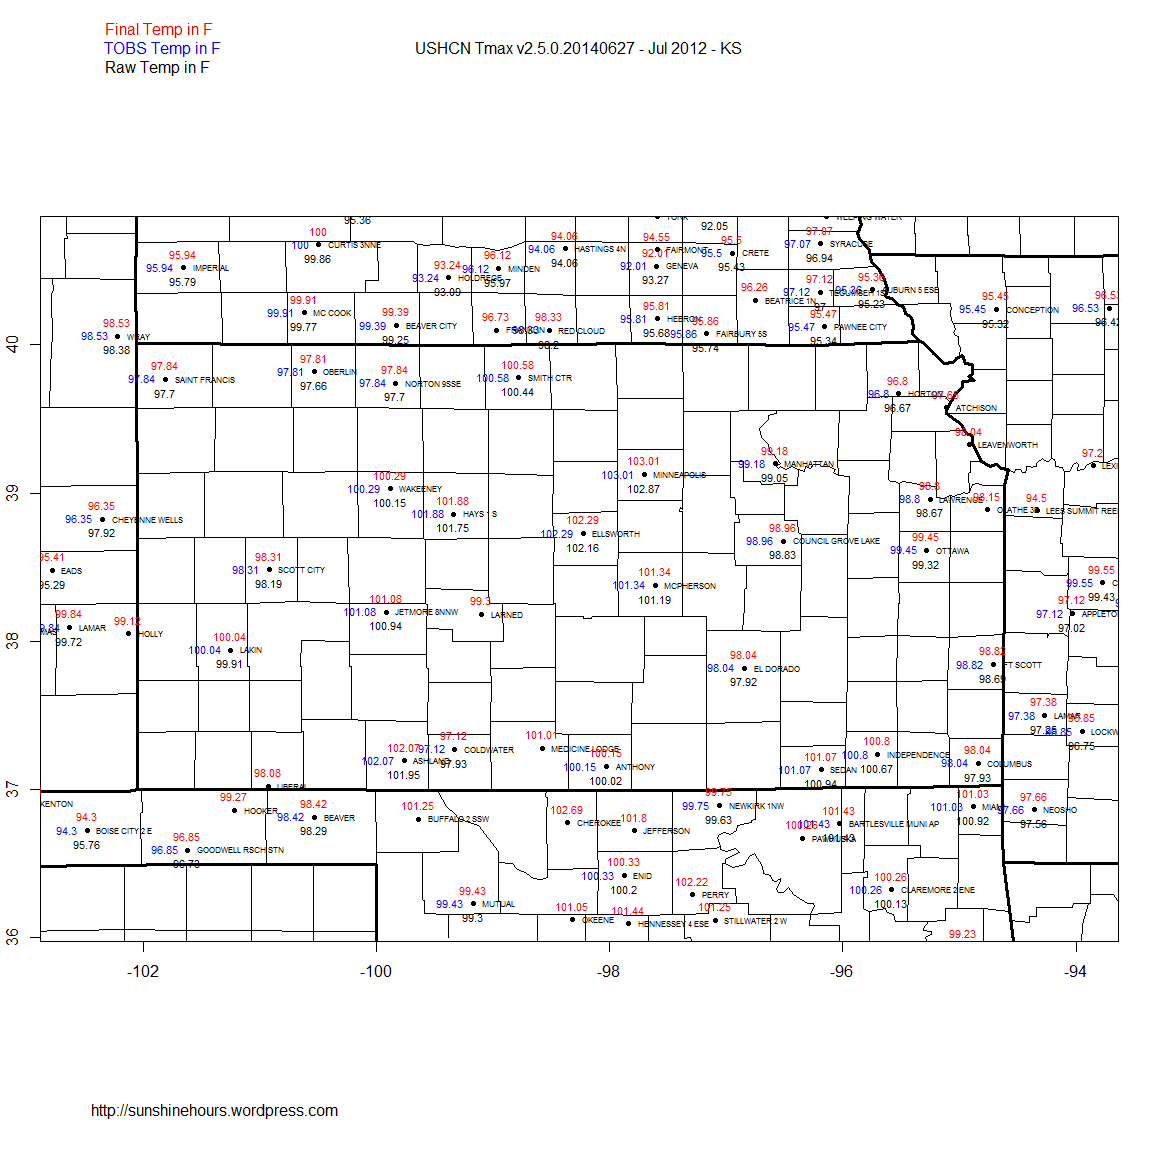

So in 2012 the TOBS added to the Mean and the Final adjustments removed from the Mean and ended up 0.09 less than Raw?
Do you know how TOBS can be applied to a completely Automatic 24 hour System, or were there still Manual stations out there in 2012?
Most stations don’t have a TOBS adjustment. I’m guessing that if there is no TOBS, then TOBS is set to Final..
But I wouldn’t do it that way. I’d set TOBS = raw if the station did not need TOBS adjustments. So I guess I’m wrong.
Thanks Bruce for the help.