Zeke has an post over at Judith Curry’s blog where he makes a claim that “infill has no effect on CONUS-wide trends” (among other claims).
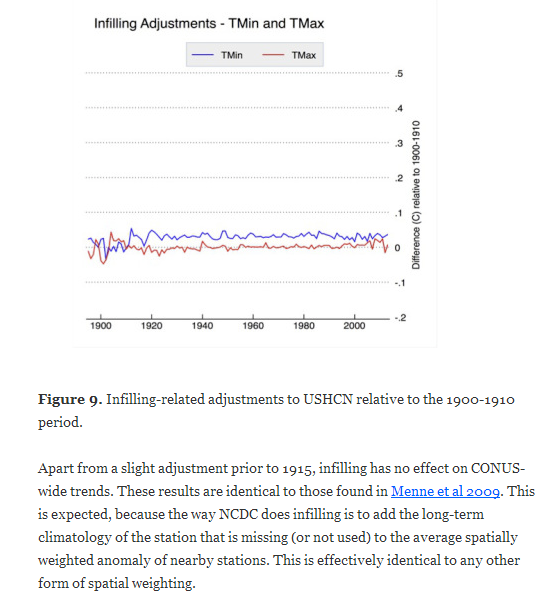
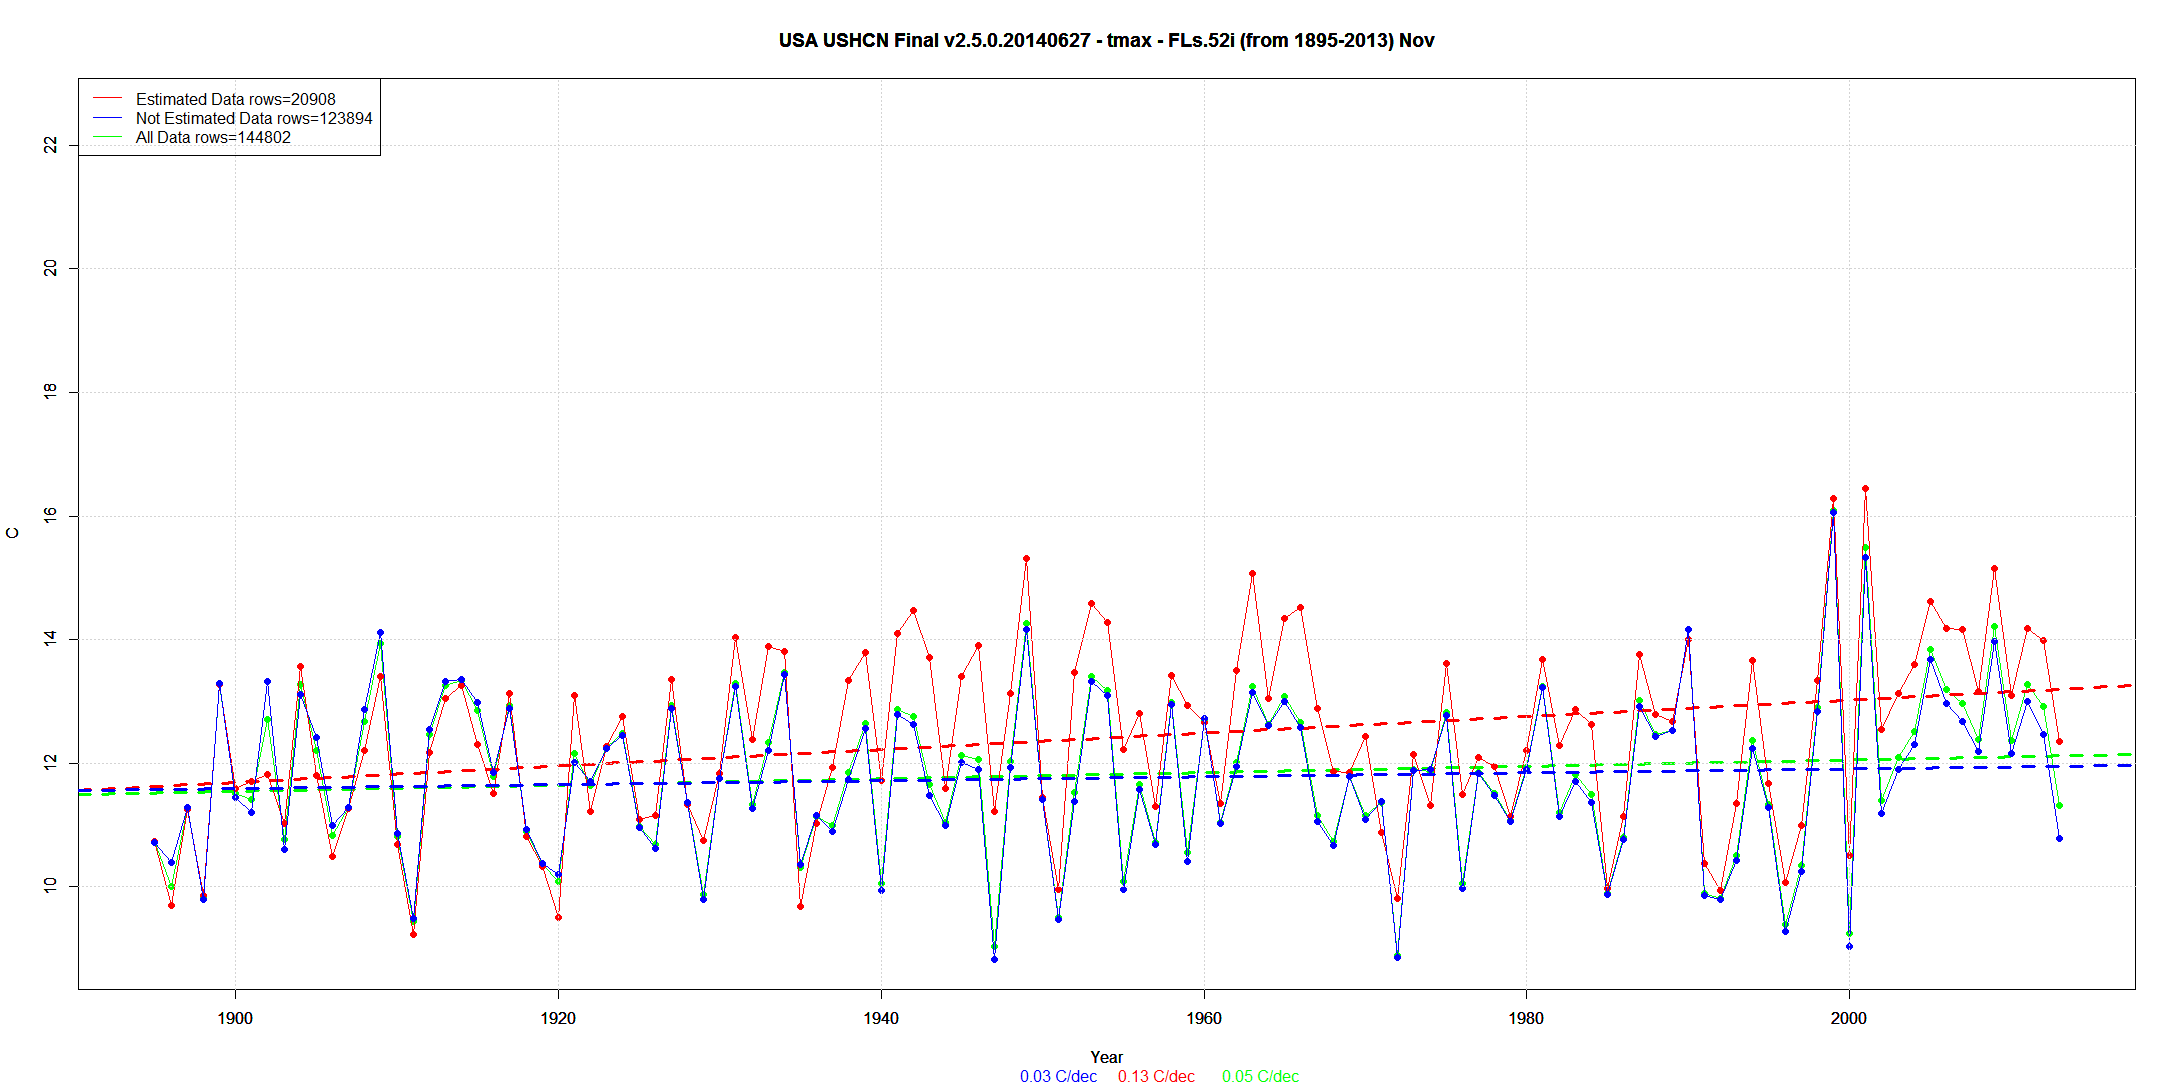
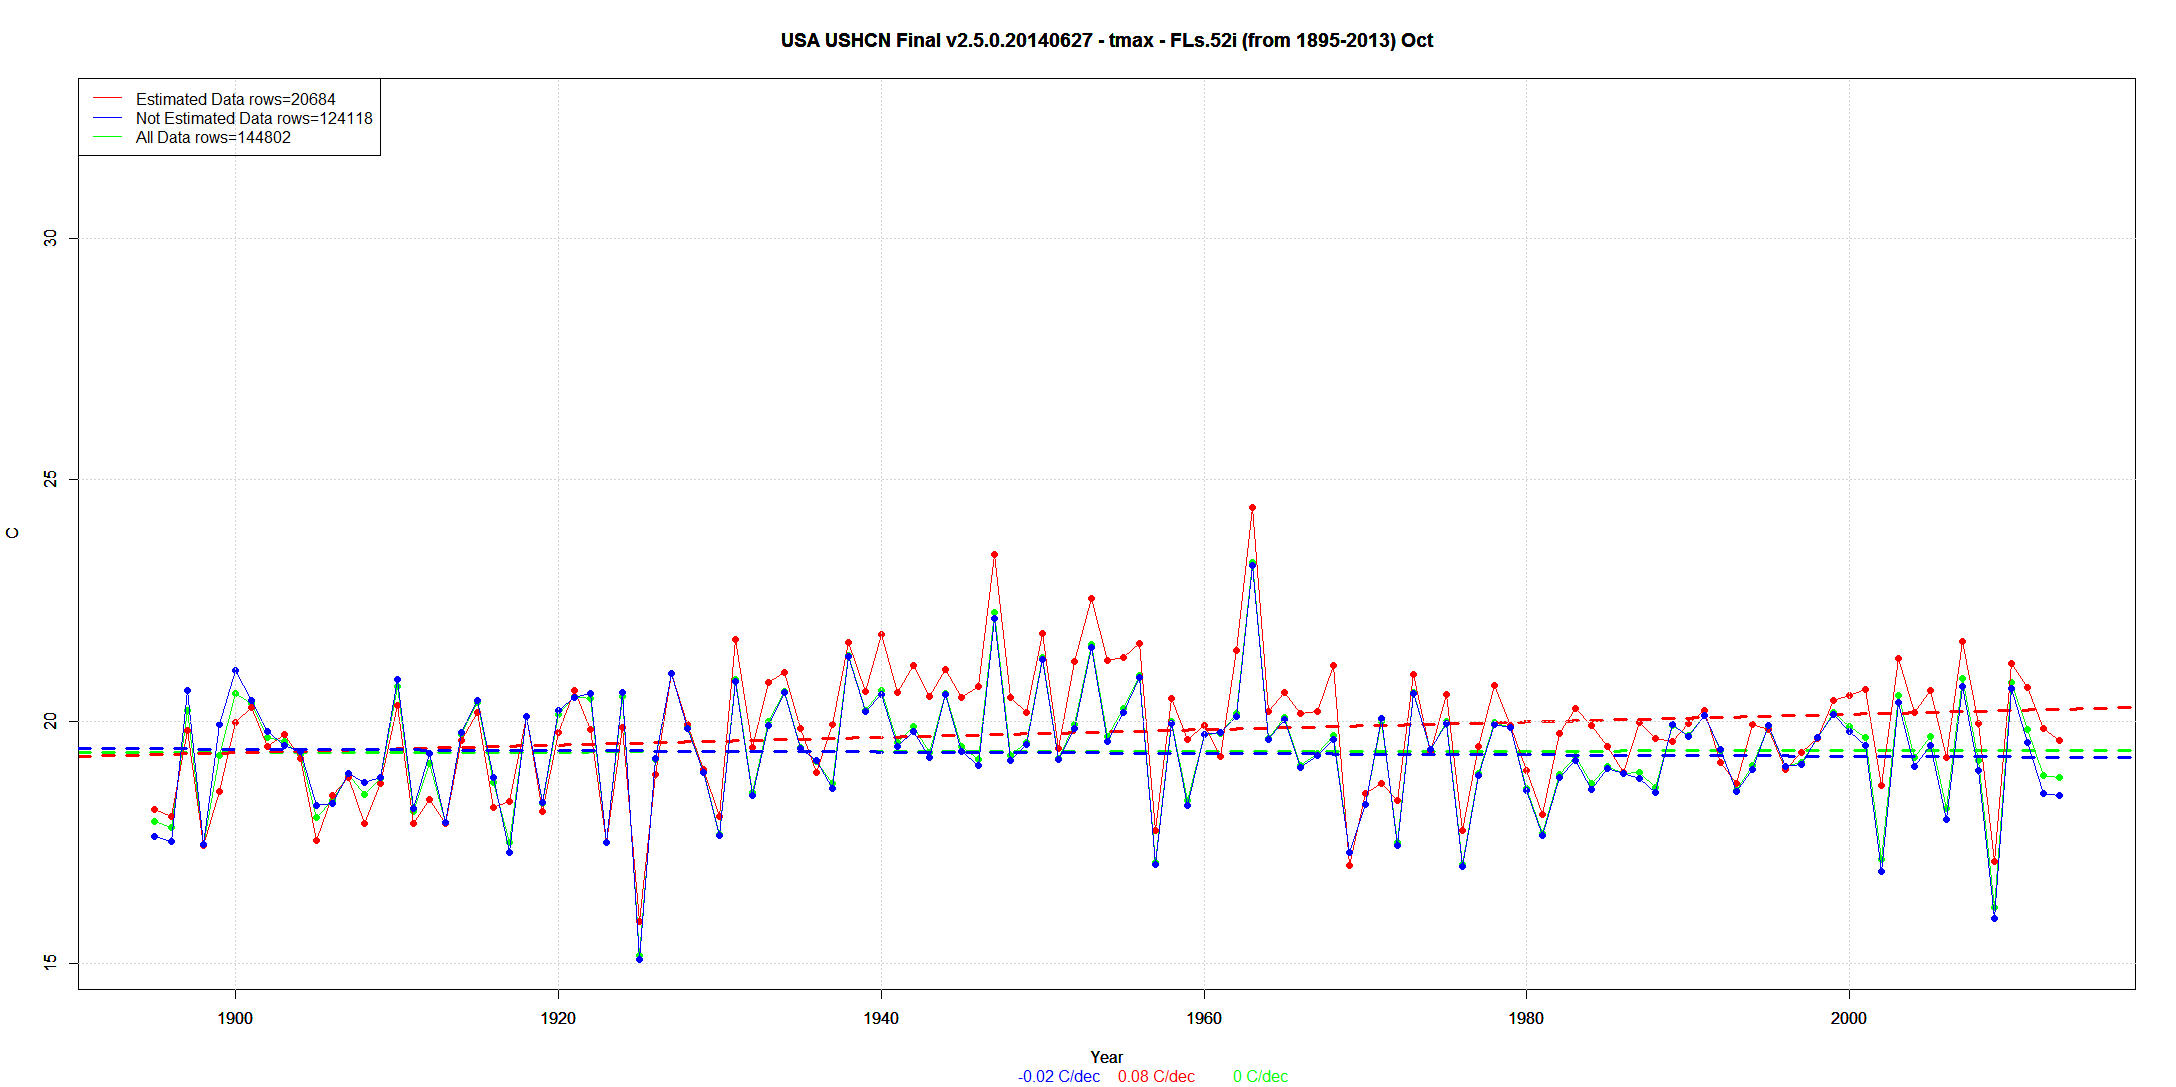
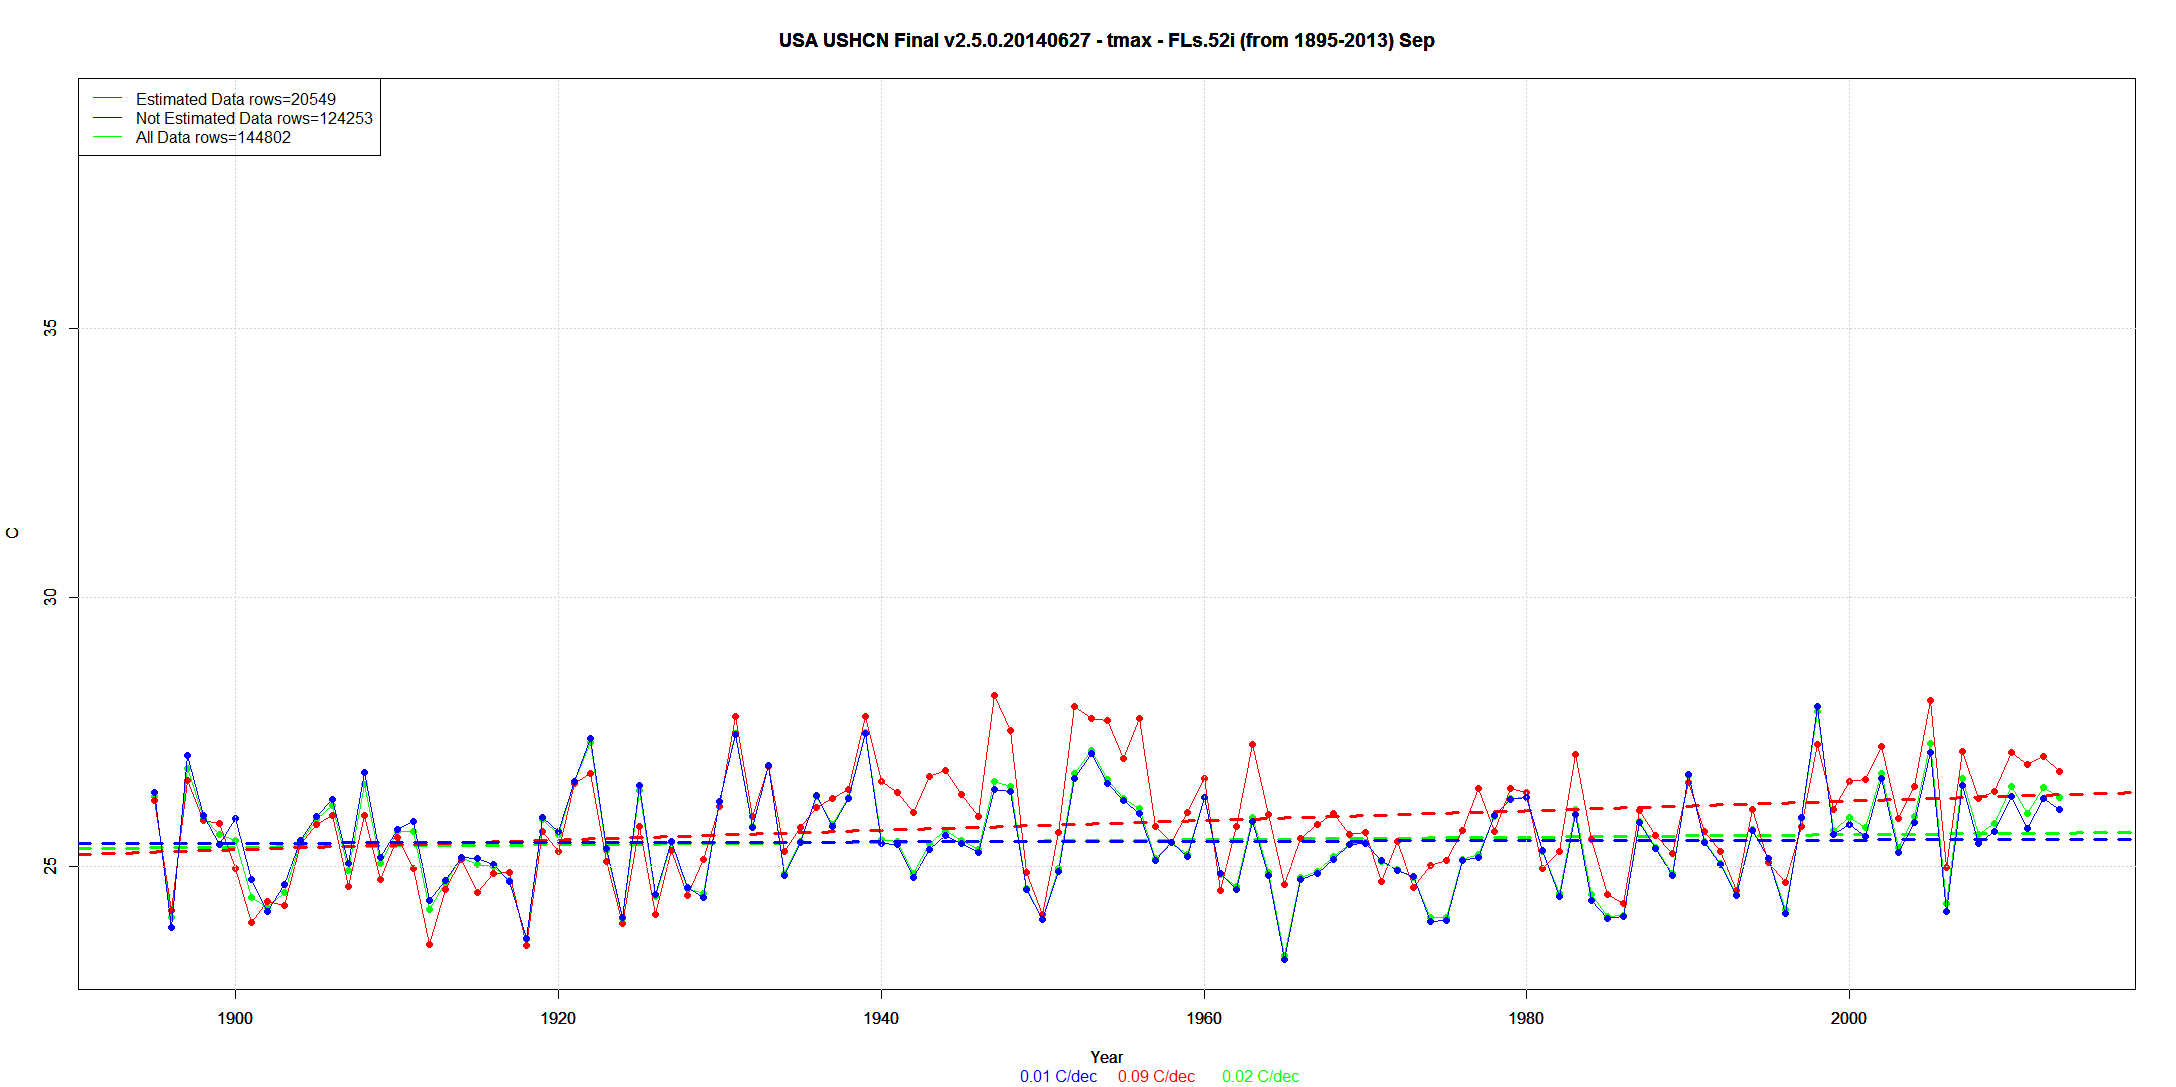
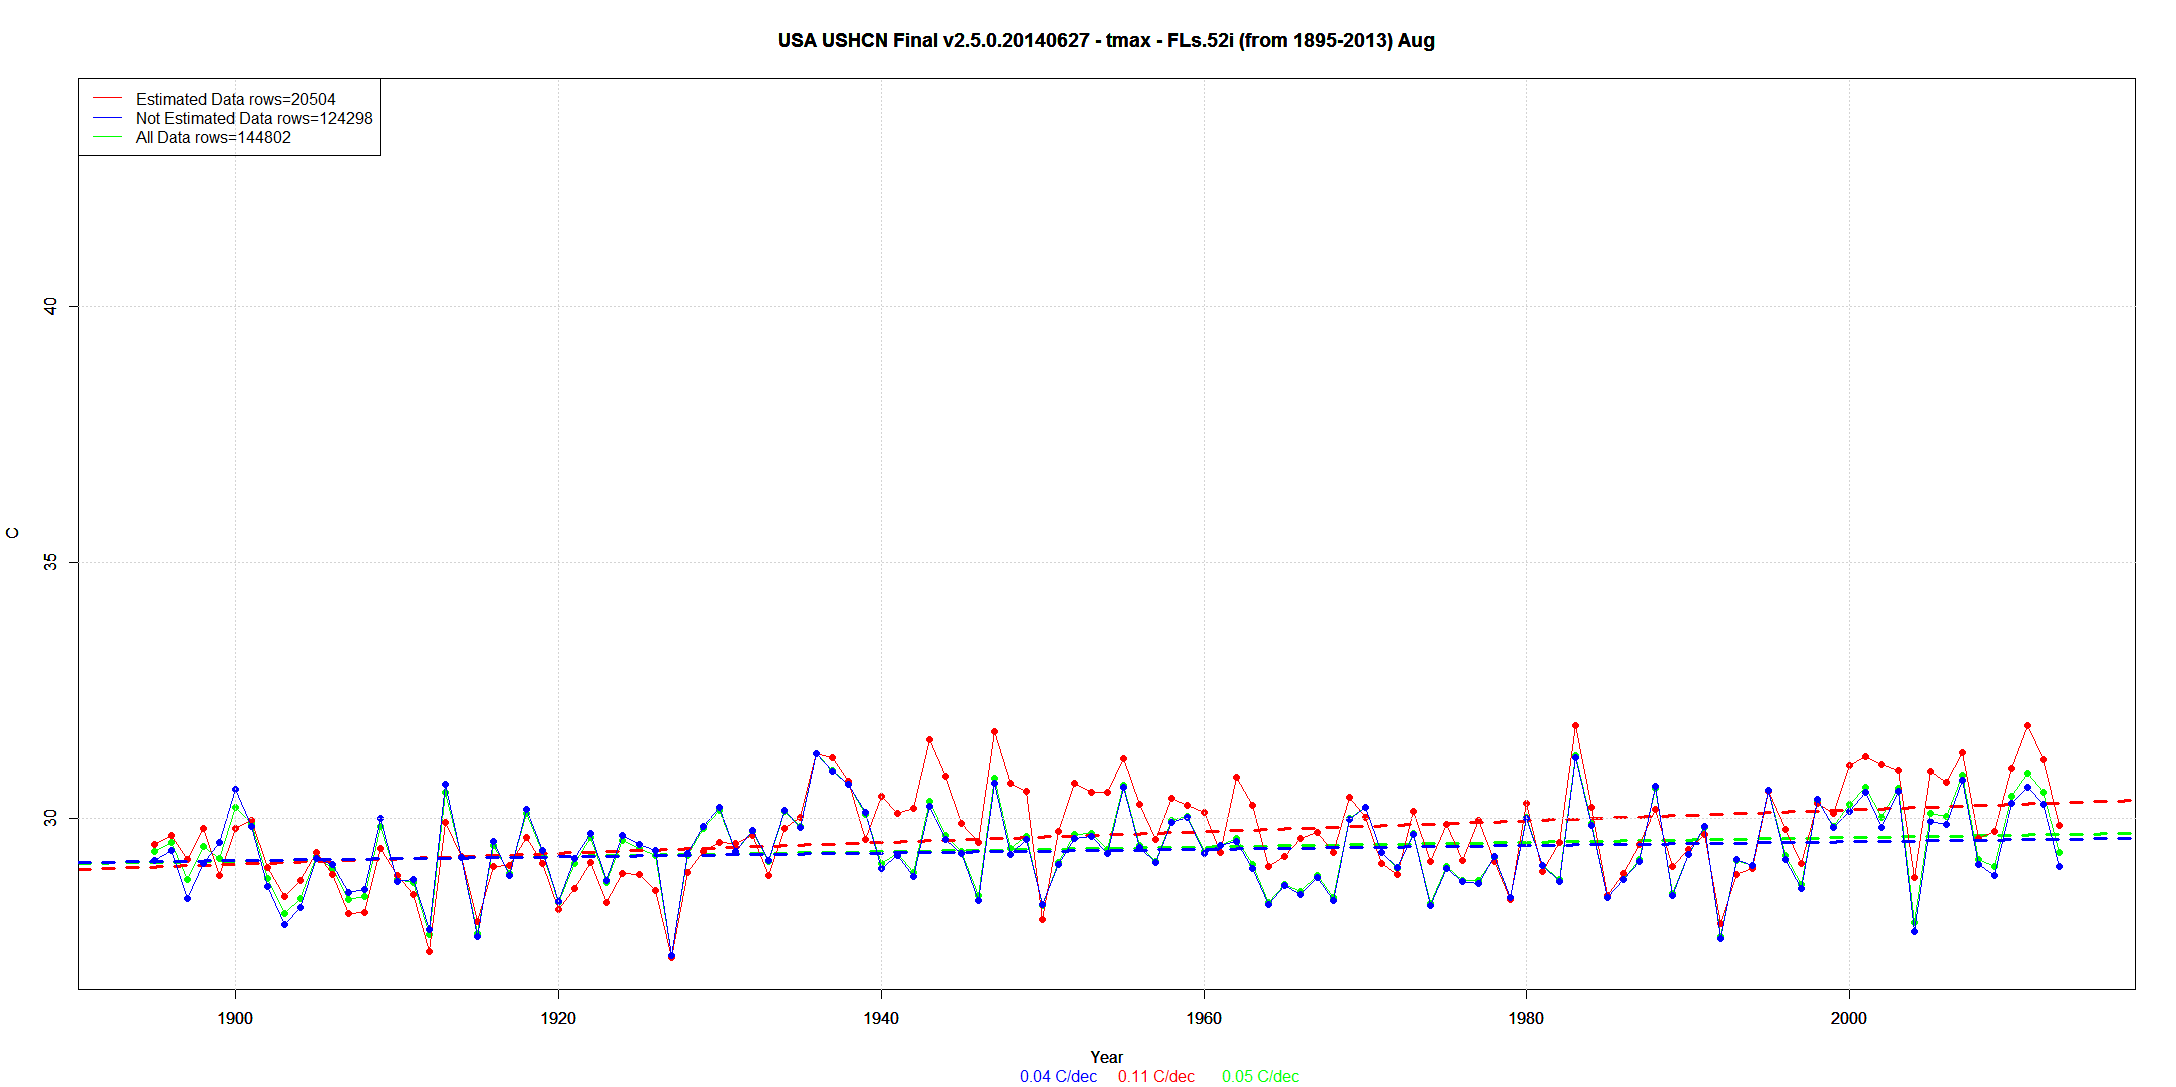
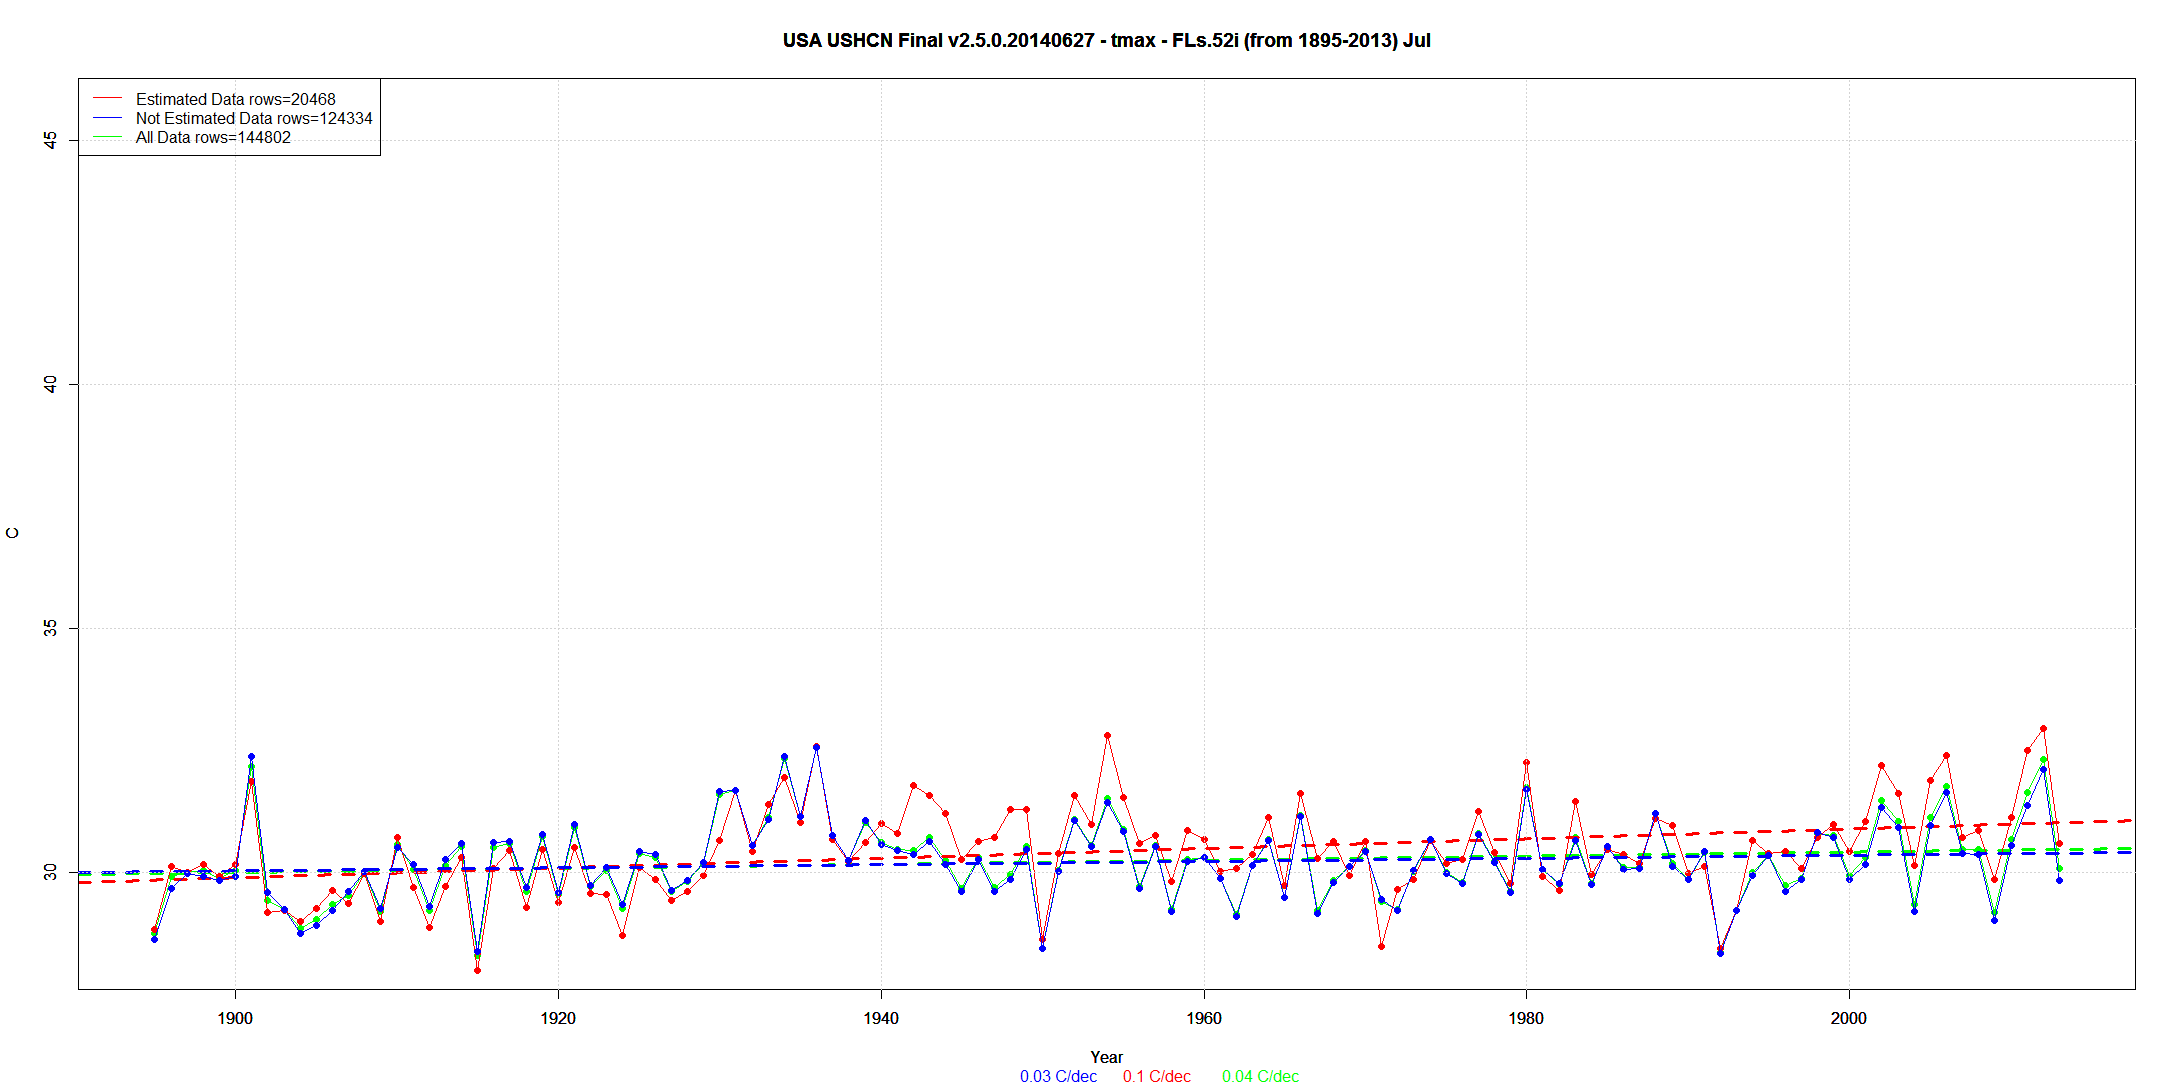
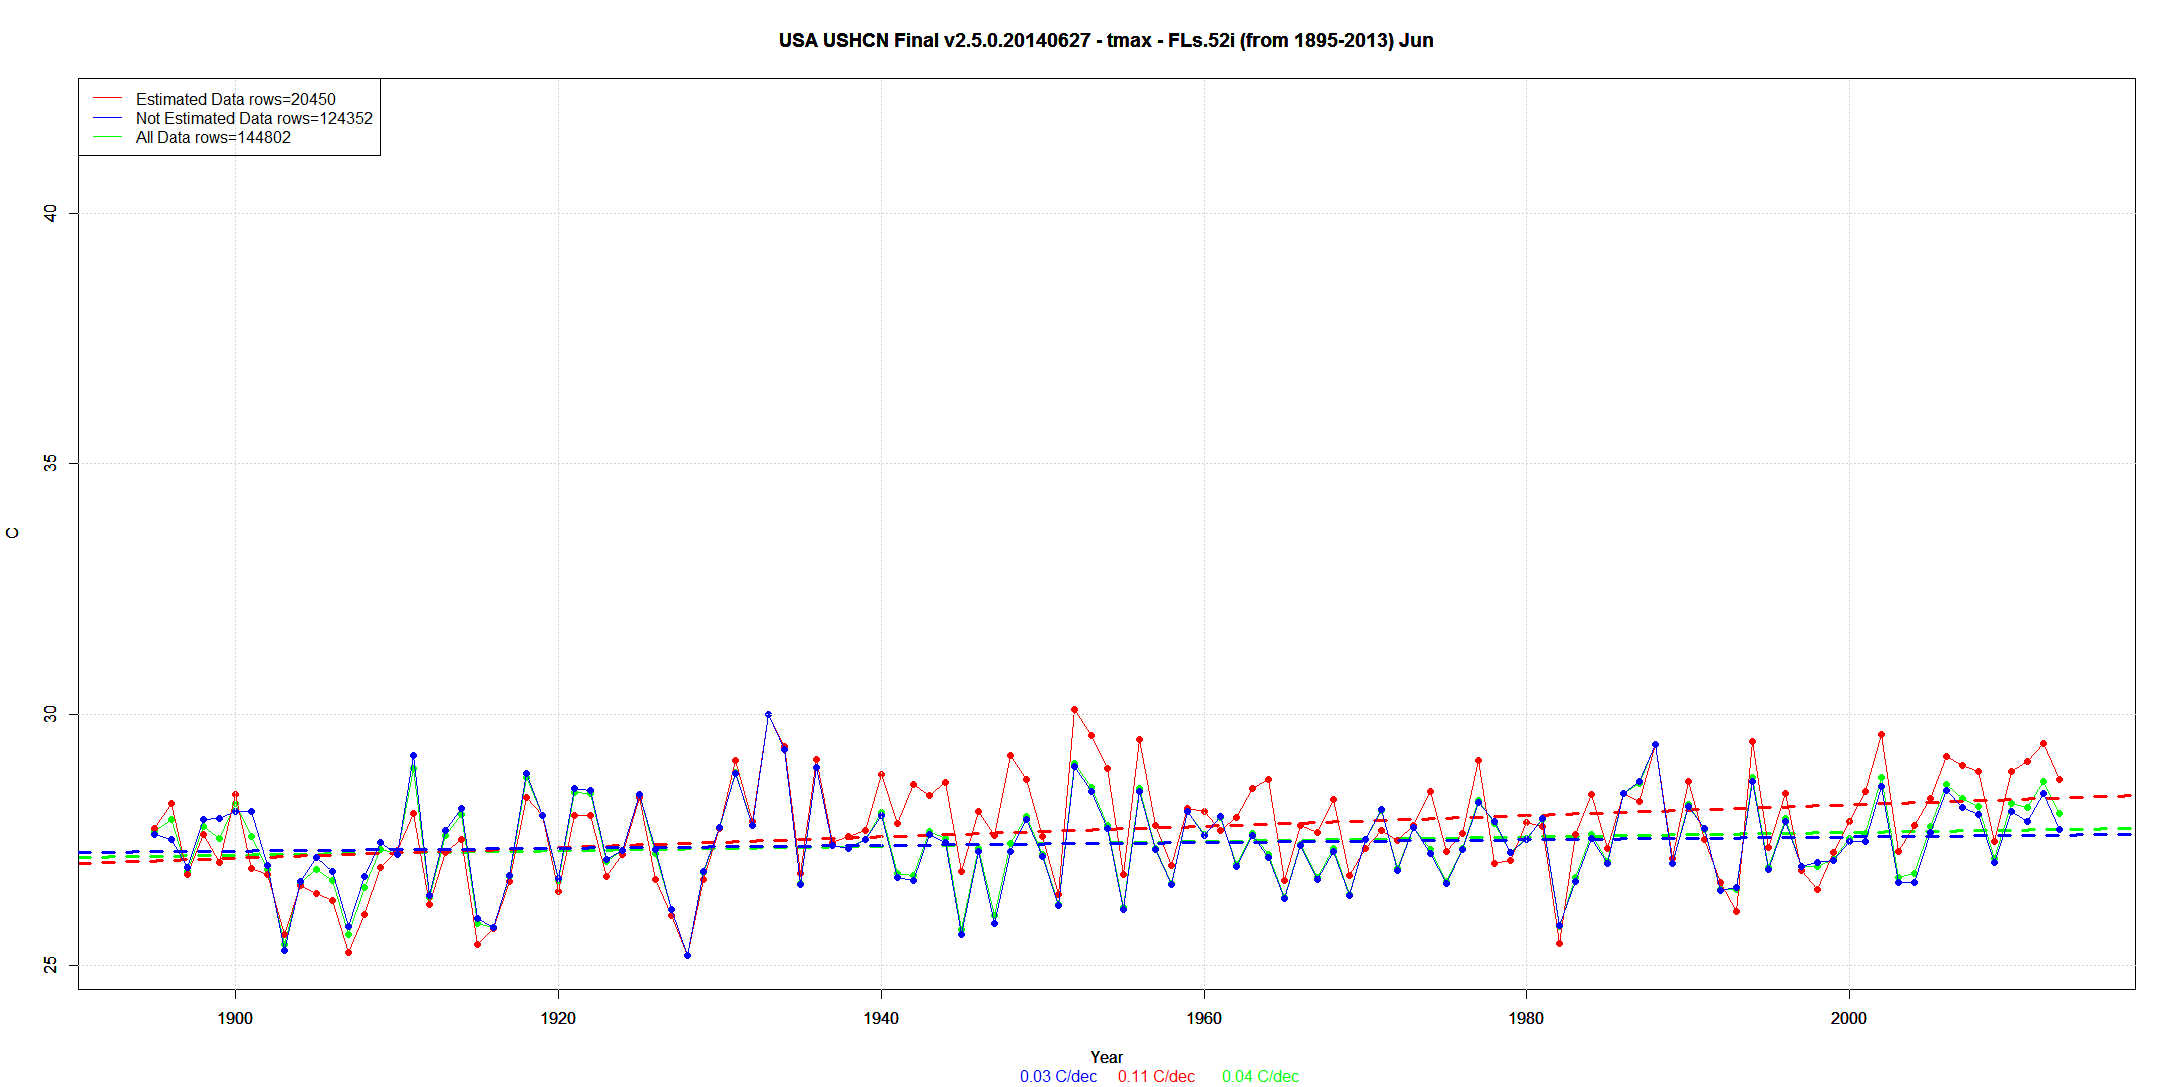
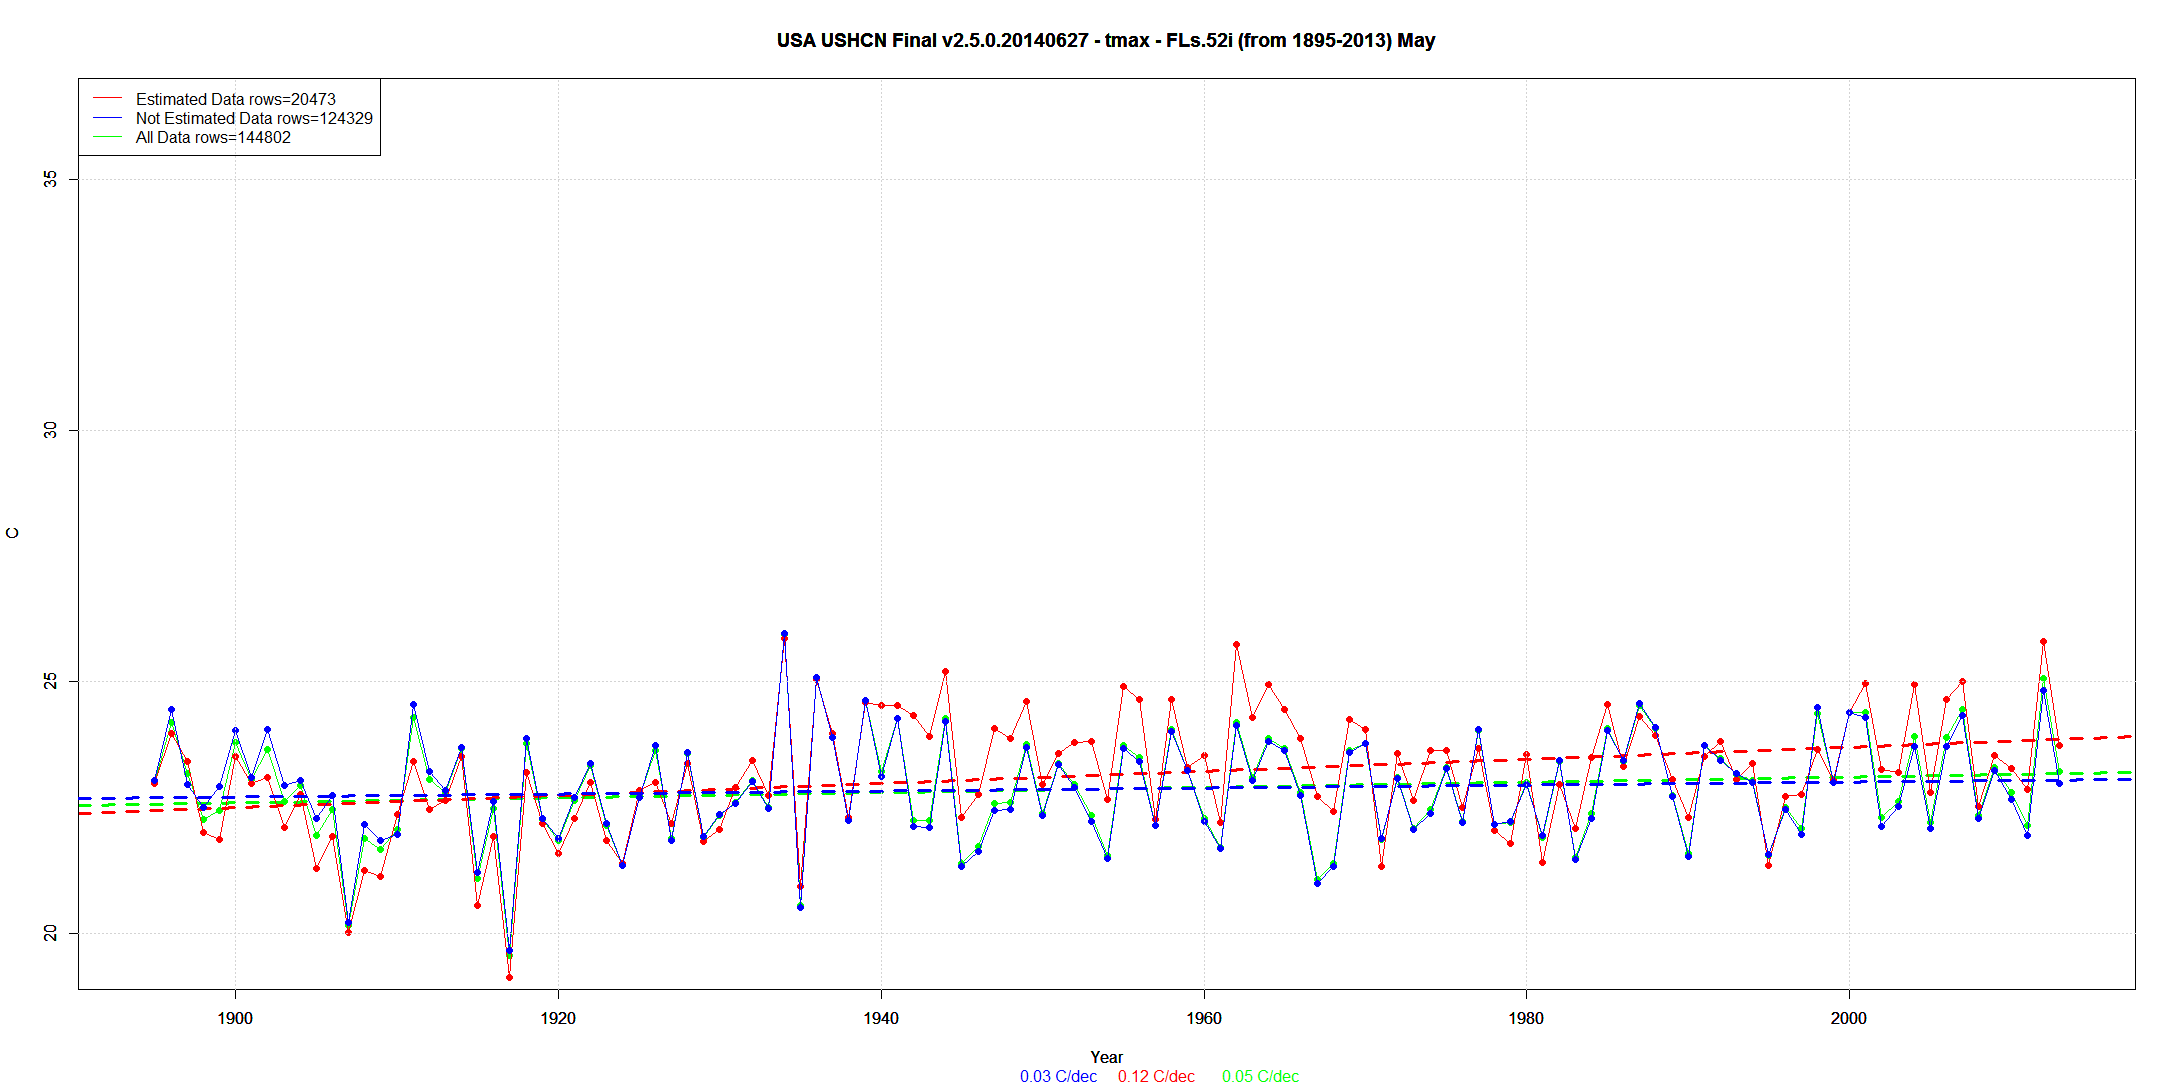
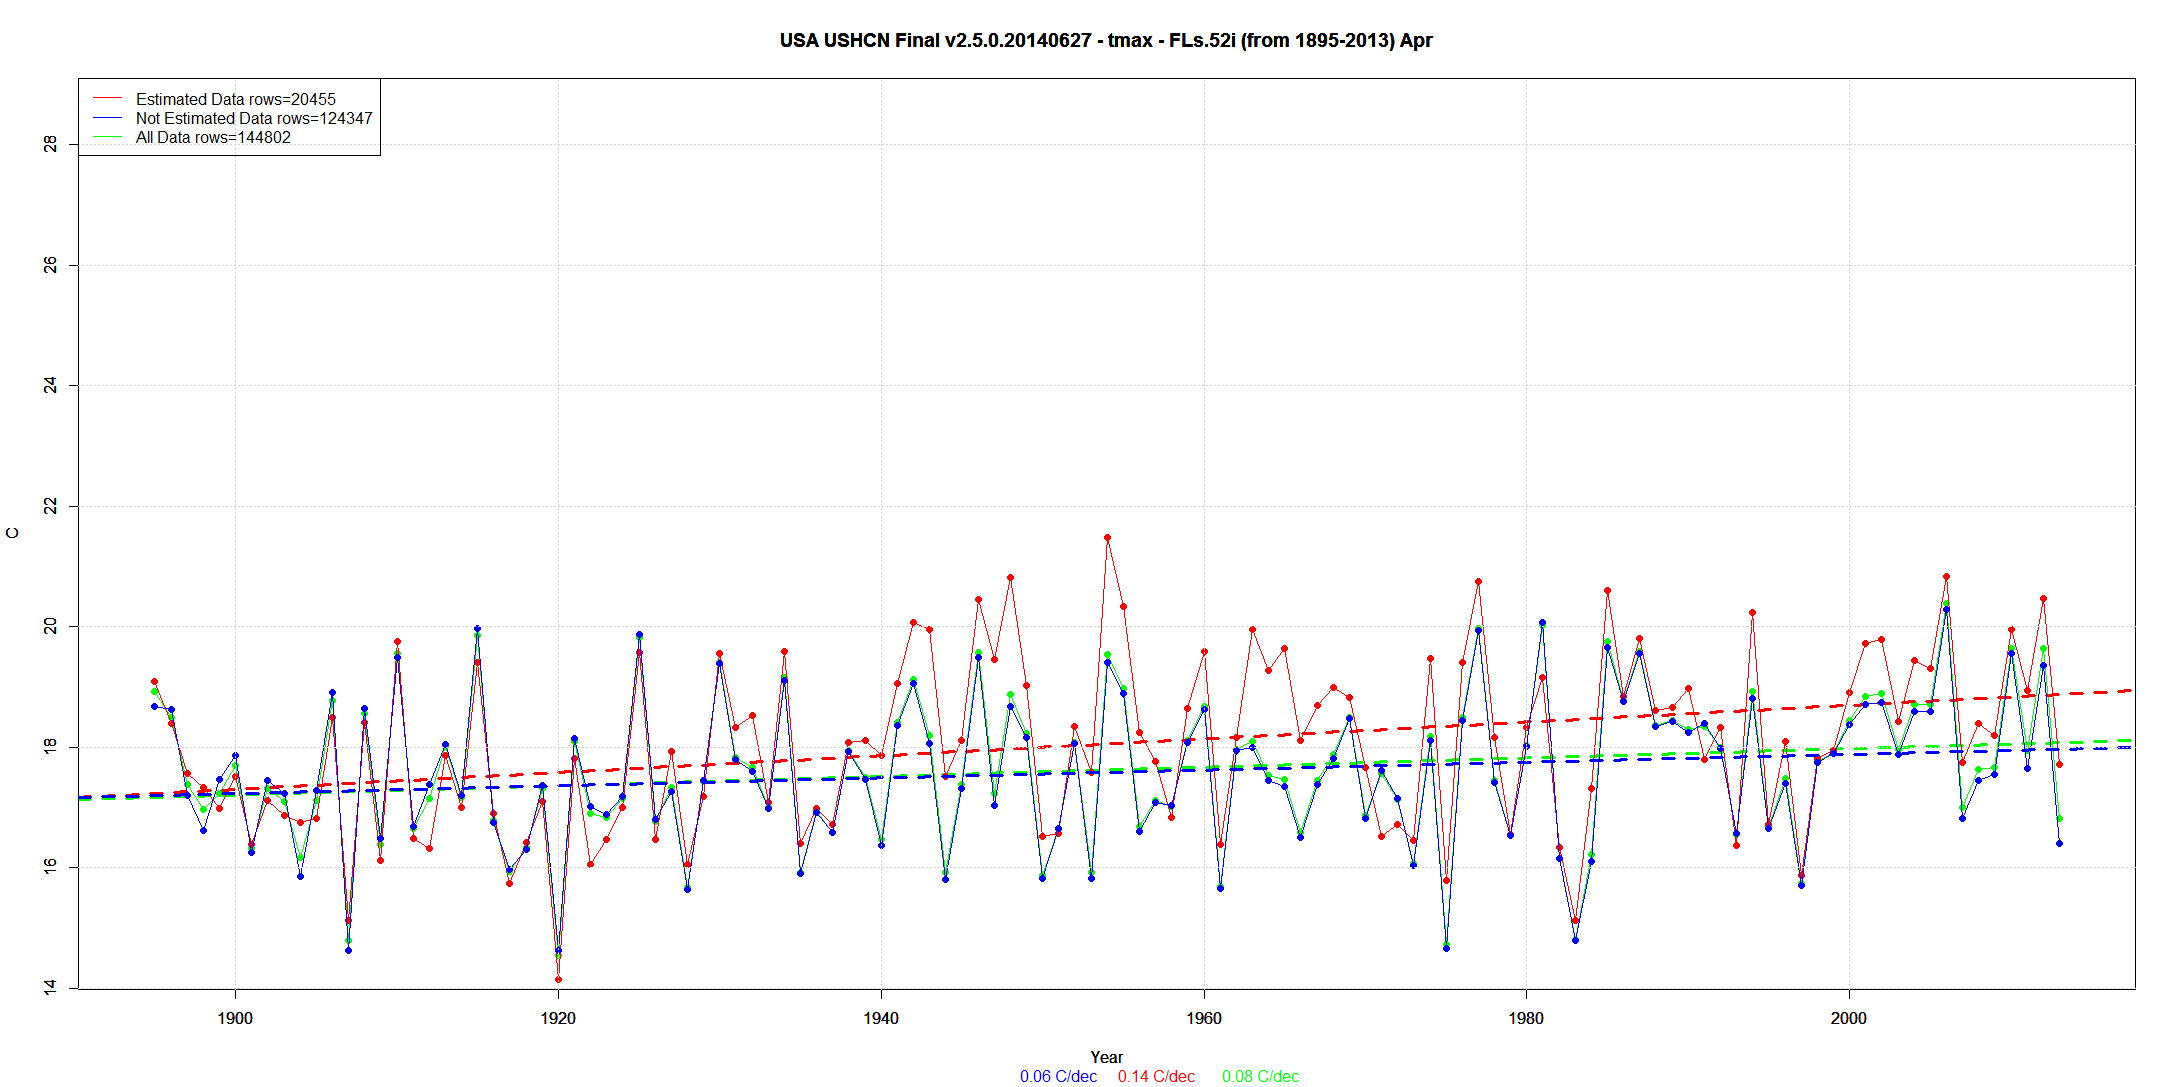
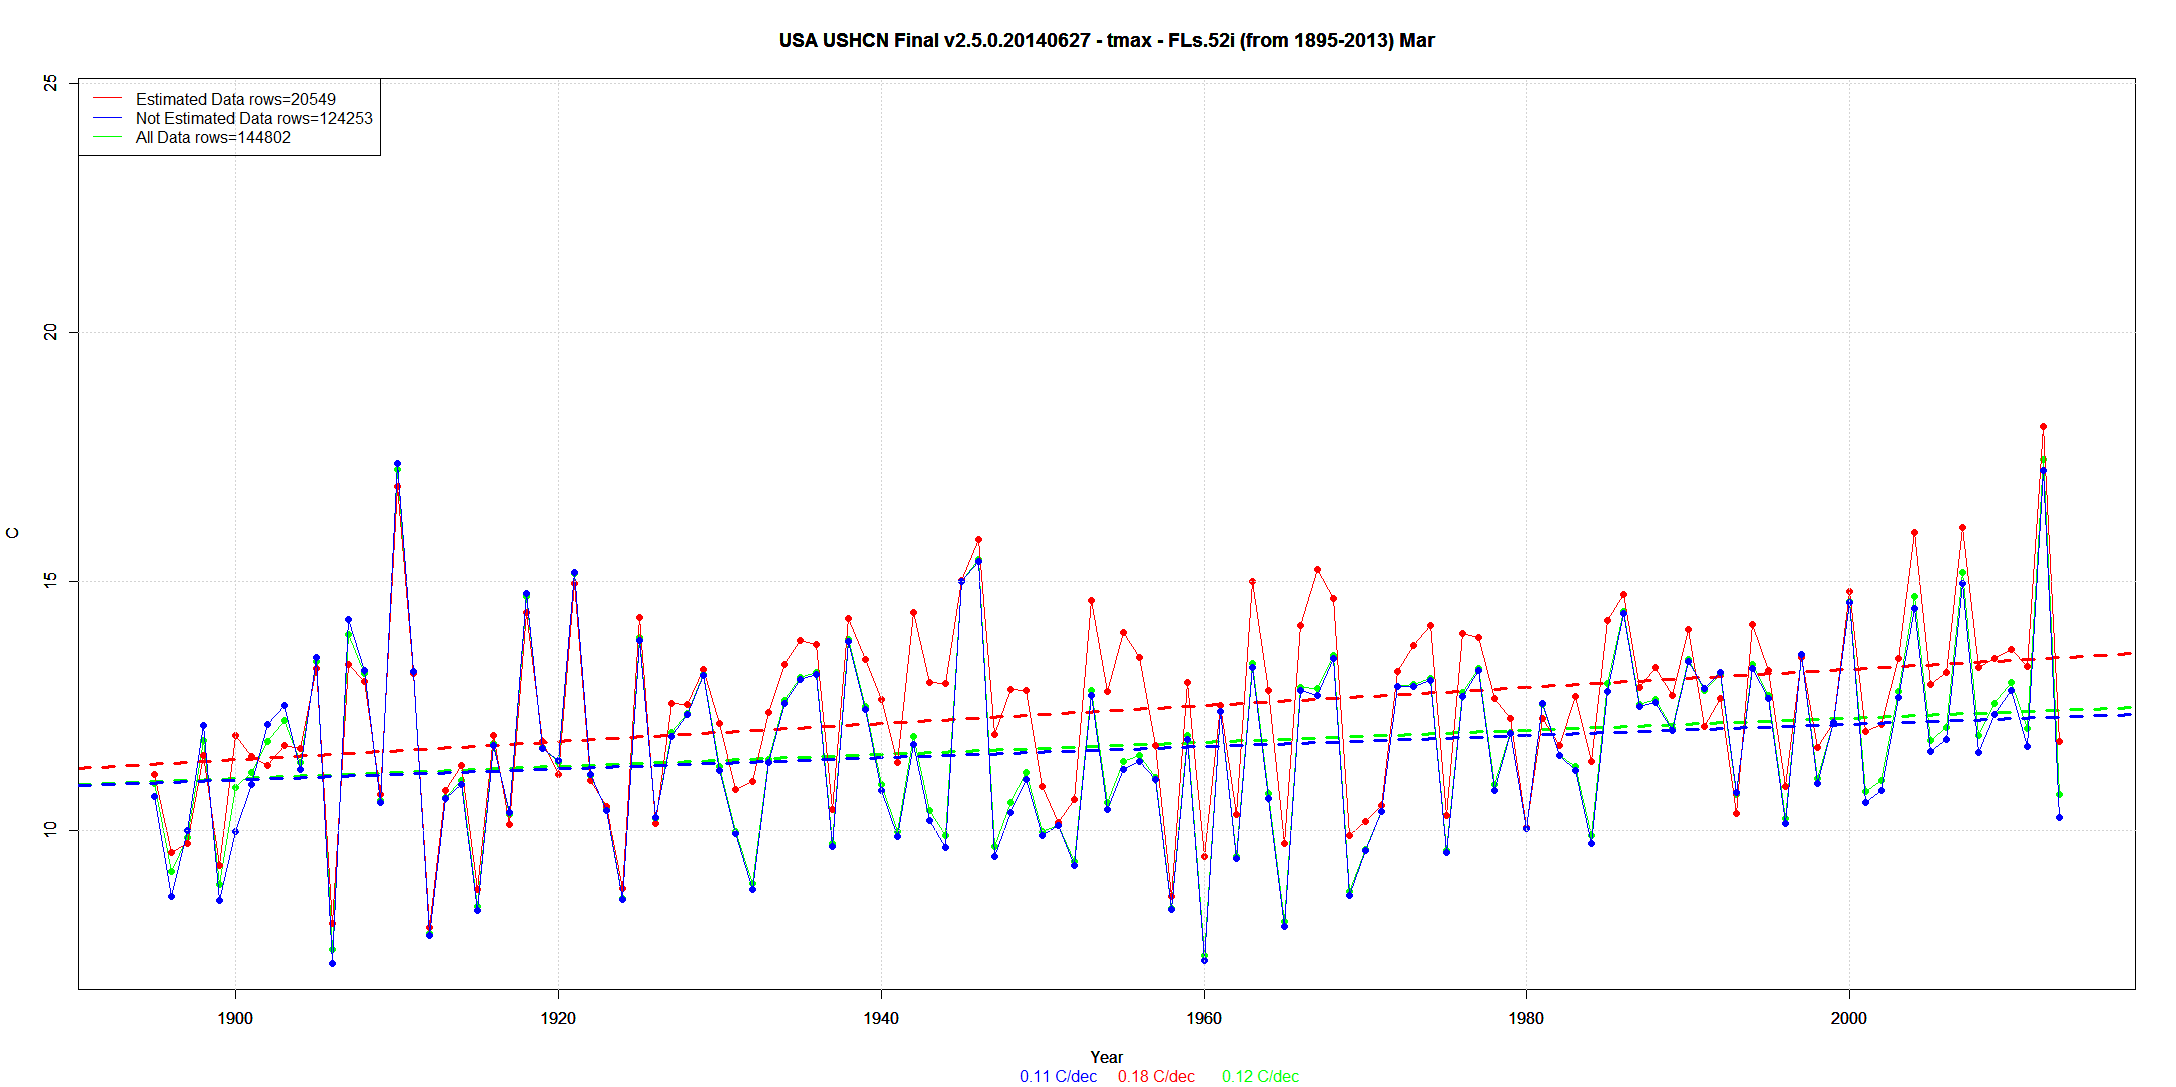
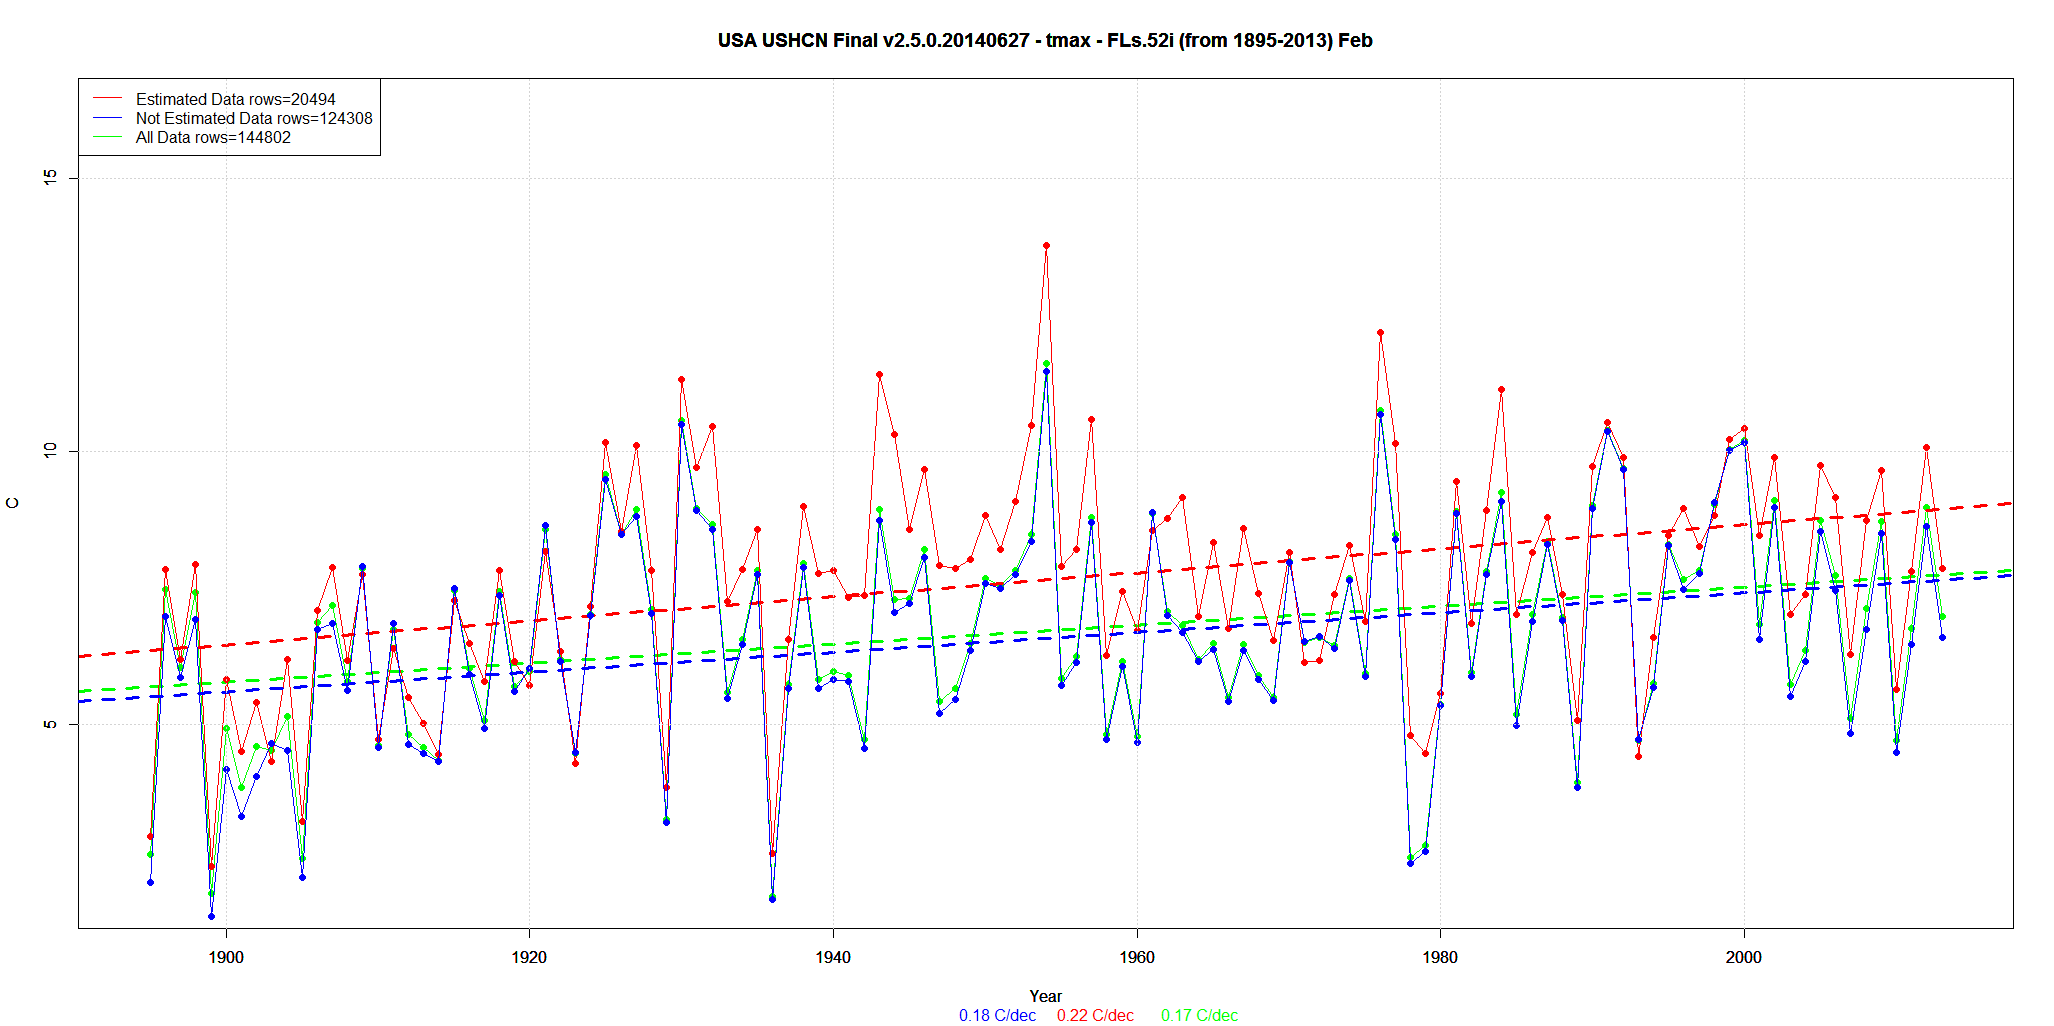
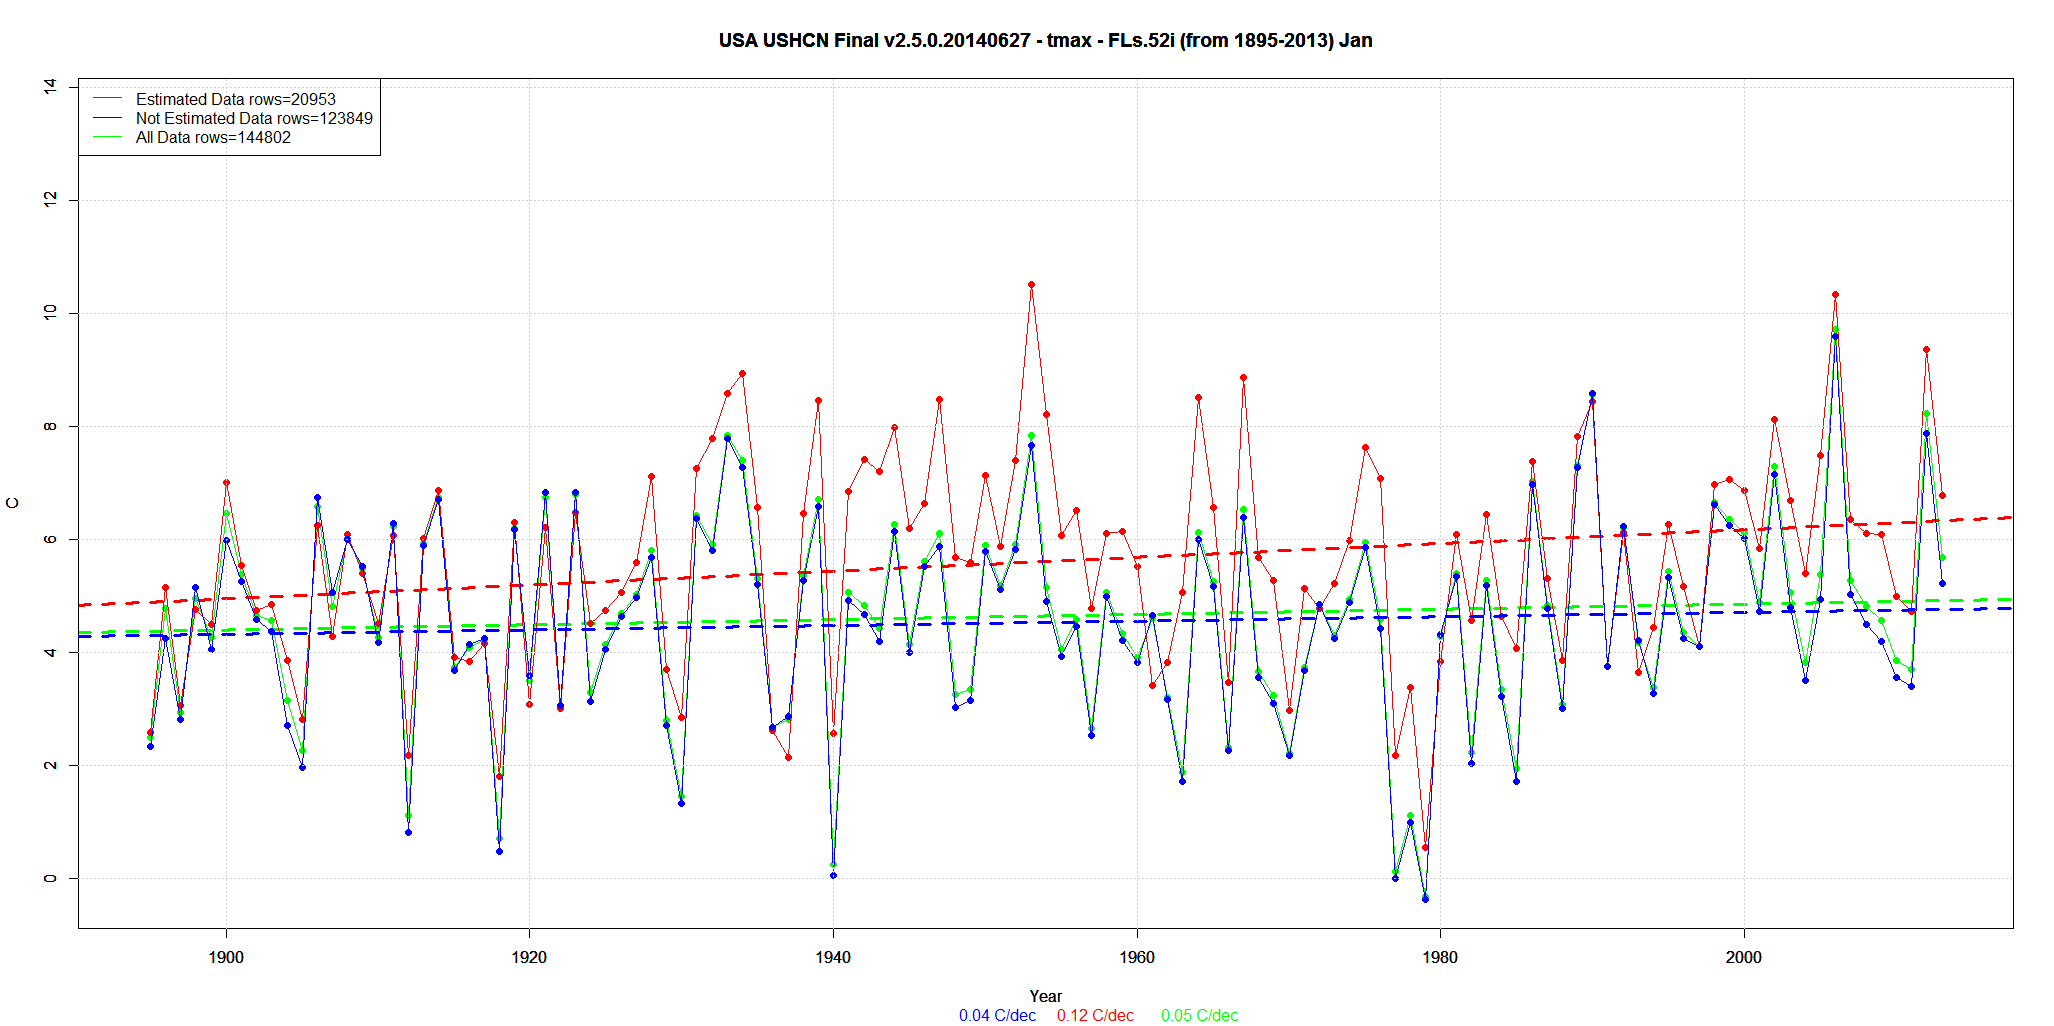
I disagree. Here are the 12 months comparing Estimated and Non-Estimated and then all the data. Blue = Final data (non-Estimated) Red = Final Data Estimated Green = All Final Data.
Infilling does change the trend. For example, Estimating changed the trend in Dec from .06C per decade to .07C per decade because the Estimated data had a trend of .15C/decade.


Reposted here.
http://notalotofpeopleknowthat.wordpress.com/2014/07/08/ushcn-estimated-data-shows-greater-warming-trend/
Two questions:
1) What would the annual trends look like.
2) What would the trend since 1930 be ?
This is TMAX data, not TAVG
I don’t usually graph annual values because I don’t use anomalies. And because I think it loses info. October is a weird month (for example) http://www.ncdc.noaa.gov/cag/time-series/us/110/00/tmax/1/10/1895-2014?base_prd=true&firstbaseyear=1901&lastbaseyear=2000
.
Annual trends would be all over the place depending on the From and To dates selected. (And by annual I mean I averaged the monthly trends)
From 1930-2013 the Annual trend for estimated is lower than non-estimated because the Estimated data in the 1930s is so high.
From 1980-2013 the Annual trend for estimated is higher than non-estimated because the Estimating algorithm is trying to continue the 1980-1998 warming.
From/To | All Data | Non-Estimated | Estimated
1930 – 2013 Jan | 0.08 | 0.06 | -0.03
1930 – 2013 Feb | 0.08 | 0.07 | -0.03
1930 – 2013 Mar | 0.23 | 0.22 | 0.13
1930 – 2013 Apr | 0.08 | 0.07 | 0.03
1930 – 2013 May | 0.03 | 0.02 | -0.02
1930 – 2013 Jun | 0.01 | 0 | -0.02
1930 – 2013 Jul | -0.04 | -0.05 | -0.02
1930 – 2013 Aug | 0 | -0.01 | 0
1930 – 2013 Sep | -0.01 | -0.02 | -0.04
1930 – 2013 Oct | -0.11 | -0.12 | -0.13
1930 – 2013 Nov | 0.08 | 0.07 | 0.04
1930 – 2013 Dec | 0 | -0.02 | -0.07
1930 – 2013 Annual | 0.04 | 0.02 | -0.01
———————-
1980 – 2013 Jan | 0.44 | 0.34 | 0.62
1980 – 2013 Feb | 0.03 | -0.05 | 0.13
1980 – 2013 Mar | 0.43 | 0.34 | 0.65
1980 – 2013 Apr | 0.19 | 0.12 | 0.39
1980 – 2013 May | 0.16 | 0.1 | 0.32
1980 – 2013 Jun | 0.2 | 0.12 | 0.41
1980 – 2013 Jul | 0.2 | 0.14 | 0.38
1980 – 2013 Aug | 0.23 | 0.17 | 0.42
1980 – 2013 Sep | 0.39 | 0.33 | 0.51
1980 – 2013 Oct | 0.13 | 0.05 | 0.25
1980 – 2013 Nov | 0.45 | 0.36 | 0.63
1980 – 2013 Dec | 0.25 | 0.13 | 0.36
1980 – 2013 Annual | 0.26 | 0.18 | 0.42
Bruce,
I’ve written a post on this here. You are tracking an average of estimated stations, where the year to year population changes considerably. The change could be just due to the fact that the stations that happen to be estimated are getting warmer, just because they are warmer places. And they are. You can show that by doing the same calc with climatology.
Or … the Estimating tries to continue a trend even when a trend ends.
Estimating fails when trends last for many years and then change direction which is exactly what temperatures does as it follows the AMO up and down.
That is why estimating is wrong. Estimating algorithms can’t deal with the 1909 trough and 1940 peaks and 1979 trough etc. They don’t have ESP. They can’t see the future …
Now if the Estimating took into account the AMO and PDO they might work. But the AGW cult blames CO2.
http://www.woodfortrees.org/plot/esrl-amo/from:1909/to/plot/hadcrut4gl/from:1909/to/plot/esrl-amo/from:1909/to:1944/trend/plot/hadcrut4gl/from:1909/to:1944/trend/plot/hadcrut4gl/from:1977/to:2010/trend/plot/esrl-amo/from:1977/to:2010/trend