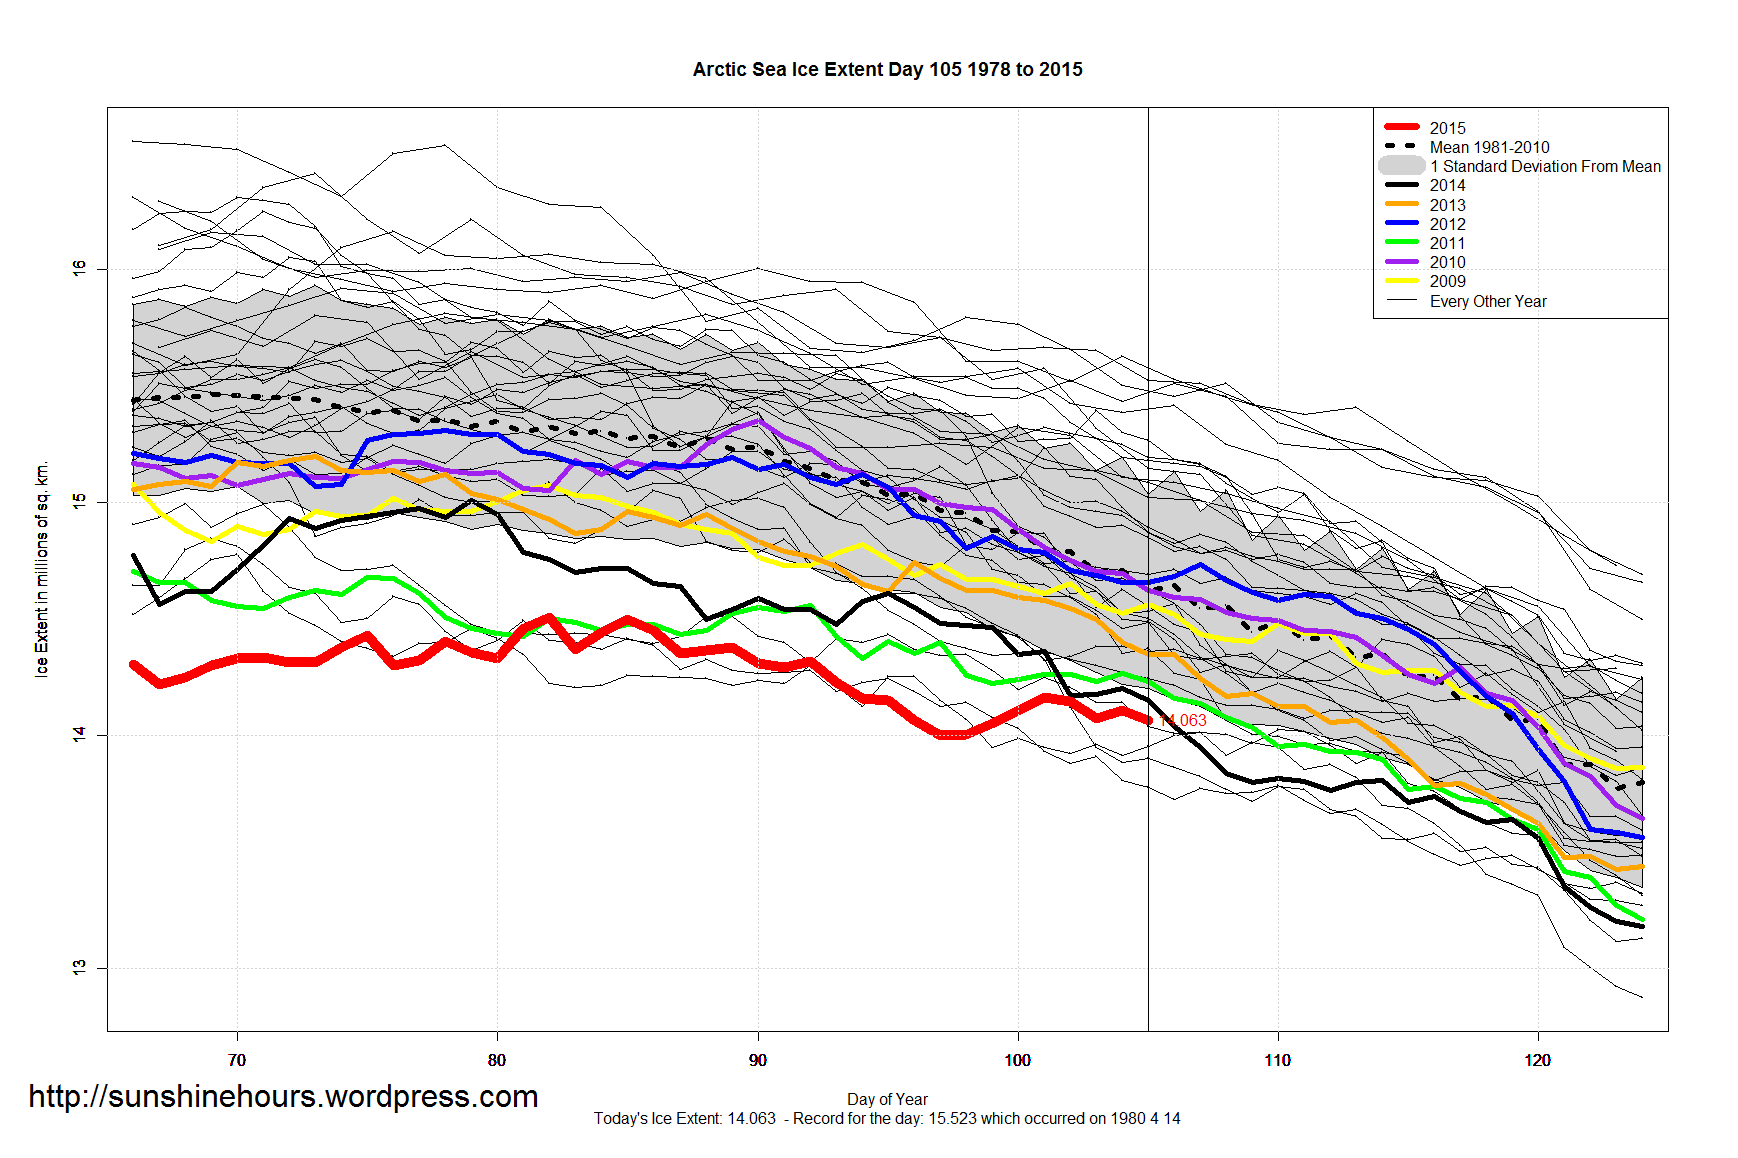
2 thoughts on “Sea Ice Extent – Day 105 – 6th Highest Global Sea Ice For This Day – Antarctic 1.5 million above ‘Normal’”
Any sea Ice Area charts. Area is a truer gauge of Sea ice cover.
One Chart I would love you to start is S Hem sea Ice AREA anomaly and sunspot data.
Extent dose not show the connection because too much Static(wind, weather and flows)
Sunspot data: landscheidt.org
Arctic sea ice volume is a better gauge of long-term Arctic stability and the PIOMAS record shows a markedly upwards tick since 2011’s lows. Antarctic sea ice extent has more use as a proxy for global albedo.
I’ve noticed over the past 20 years that the Arctic summer melt starts later and declines much faster than historical records pre-1995. There is a flattening out of the max extent (obvious in this year’s chart) which begs the question, Why? If you can blame it on wind patterns compressing and expanding the ice pack, why wouldn’t that also account for the declines seen in previous years? Does anyone track wind compression to extent beyond what Watts has linked to on his website?