If Antarctica has reached max (and certainly I make no predictions this year)
| Year | Min | Max | dMax | dMin | Avg_Anomaly |
| 1979 | 2.915 | 18.368 | 256 | 48 | 0.04 |
| 1980 | 2.527 | 19.092 | 267 | 57 | -0.39 |
| 1981 | 2.695 | 18.86 | 261 | 51 | -0.21 |
| 1982 | 2.893 | 18.551 | 246 | 52 | -0.02 |
| 1983 | 2.847 | 18.811 | 263 | 55 | -0.25 |
| 1984 | 2.383 | 18.378 | 266 | 58 | -0.2 |
| 1985 | 2.602 | 18.933 | 254 | 50 | -0.04 |
| 1986 | 2.954 | 18.027 | 261 | 65 | -0.55 |
| 1987 | 3.016 | 18.524 | 258 | 52 | -0.24 |
| 1988 | 2.639 | 18.785 | 277 | 55 | -0.14 |
| 1989 | 2.723 | 18.274 | 266 | 51 | -0.23 |
| 1990 | 2.784 | 18.379 | 273 | 53 | -0.24 |
| 1991 | 2.554 | 18.671 | 273 | 58 | -0.11 |
| 1992 | 2.492 | 18.467 | 255 | 54 | -0.24 |
| 1993 | 2.281 | 18.71 | 263 | 50 | -0.23 |
| 1994 | 3.083 | 18.827 | 243 | 43 | 0.12 |
| 1995 | 3.33 | 18.736 | 269 | 55 | 0.15 |
| 1996 | 2.597 | 18.831 | 267 | 56 | 0.13 |
| 1997 | 2.264 | 18.792 | 265 | 58 | -0.26 |
| 1998 | 2.772 | 19.244 | 258 | 56 | 0.08 |
| 1999 | 2.707 | 18.981 | 273 | 51 | 0.11 |
| 2000 | 2.582 | 19.159 | 272 | 49 | 0.11 |
| 2001 | 3.441 | 18.494 | 271 | 50 | 0.02 |
| 2002 | 2.697 | 18.116 | 252 | 51 | -0.43 |
| 2003 | 3.626 | 18.68 | 268 | 48 | 0.32 |
| 2004 | 3.259 | 19.124 | 252 | 51 | 0.32 |
| 2005 | 2.804 | 19.295 | 272 | 49 | 0.04 |
| 2006 | 2.487 | 19.36 | 264 | 51 | -0.19 |
| 2007 | 2.723 | 19.086 | 272 | 50 | 0.03 |
| 2008 | 3.692 | 18.298 | 247 | 51 | 0.6 |
| 2009 | 2.671 | 19.299 | 267 | 53 | 0.39 |
| 2010 | 2.842 | 18.998 | 249 | 47 | 0.45 |
| 2011 | 2.319 | 18.954 | 266 | 53 | -0.15 |
| 2012 | 3.111 | 19.478 | 266 | 54 | 0.36 |
| 2013 | 3.679 | 19.608 | 274 | 50 | 0.87 |
| 2014 | 3.548 | 20.201 | 263 | 52 | 1.12 |
| 2015 (ignoring strange data) | 3.532 | 18.874 | 275 | 49 | |
| 2015 (using strange data) | 3.532 | 20.723 | 266 | 49 |
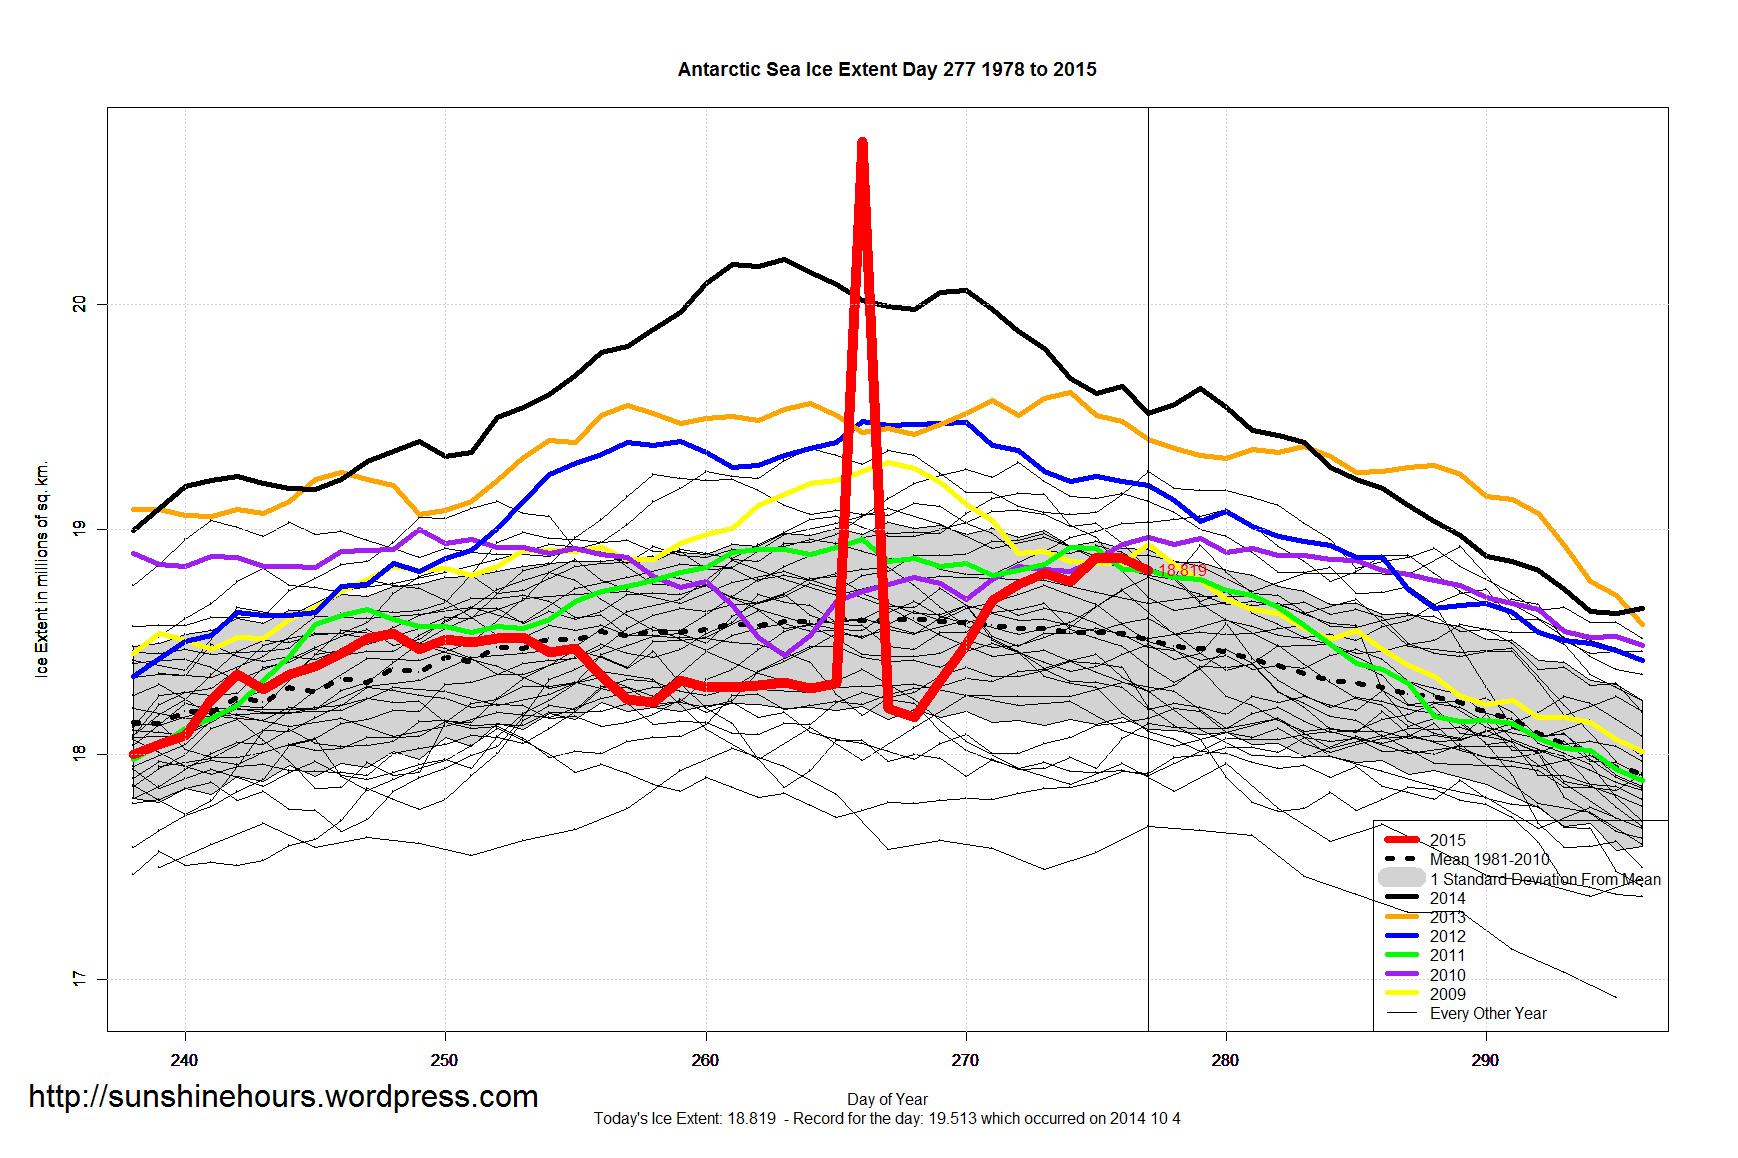


We can probably ignore the “strange data”, even though they seem reluctant to correct it. But, if we ignore it, that makes 2015 the 2nd latest “turn” yet recorded. (1988 being the latest, from your chart.)
Most interesting.
Ozone Hole Oct. 2, 2015; one of the largest ever!


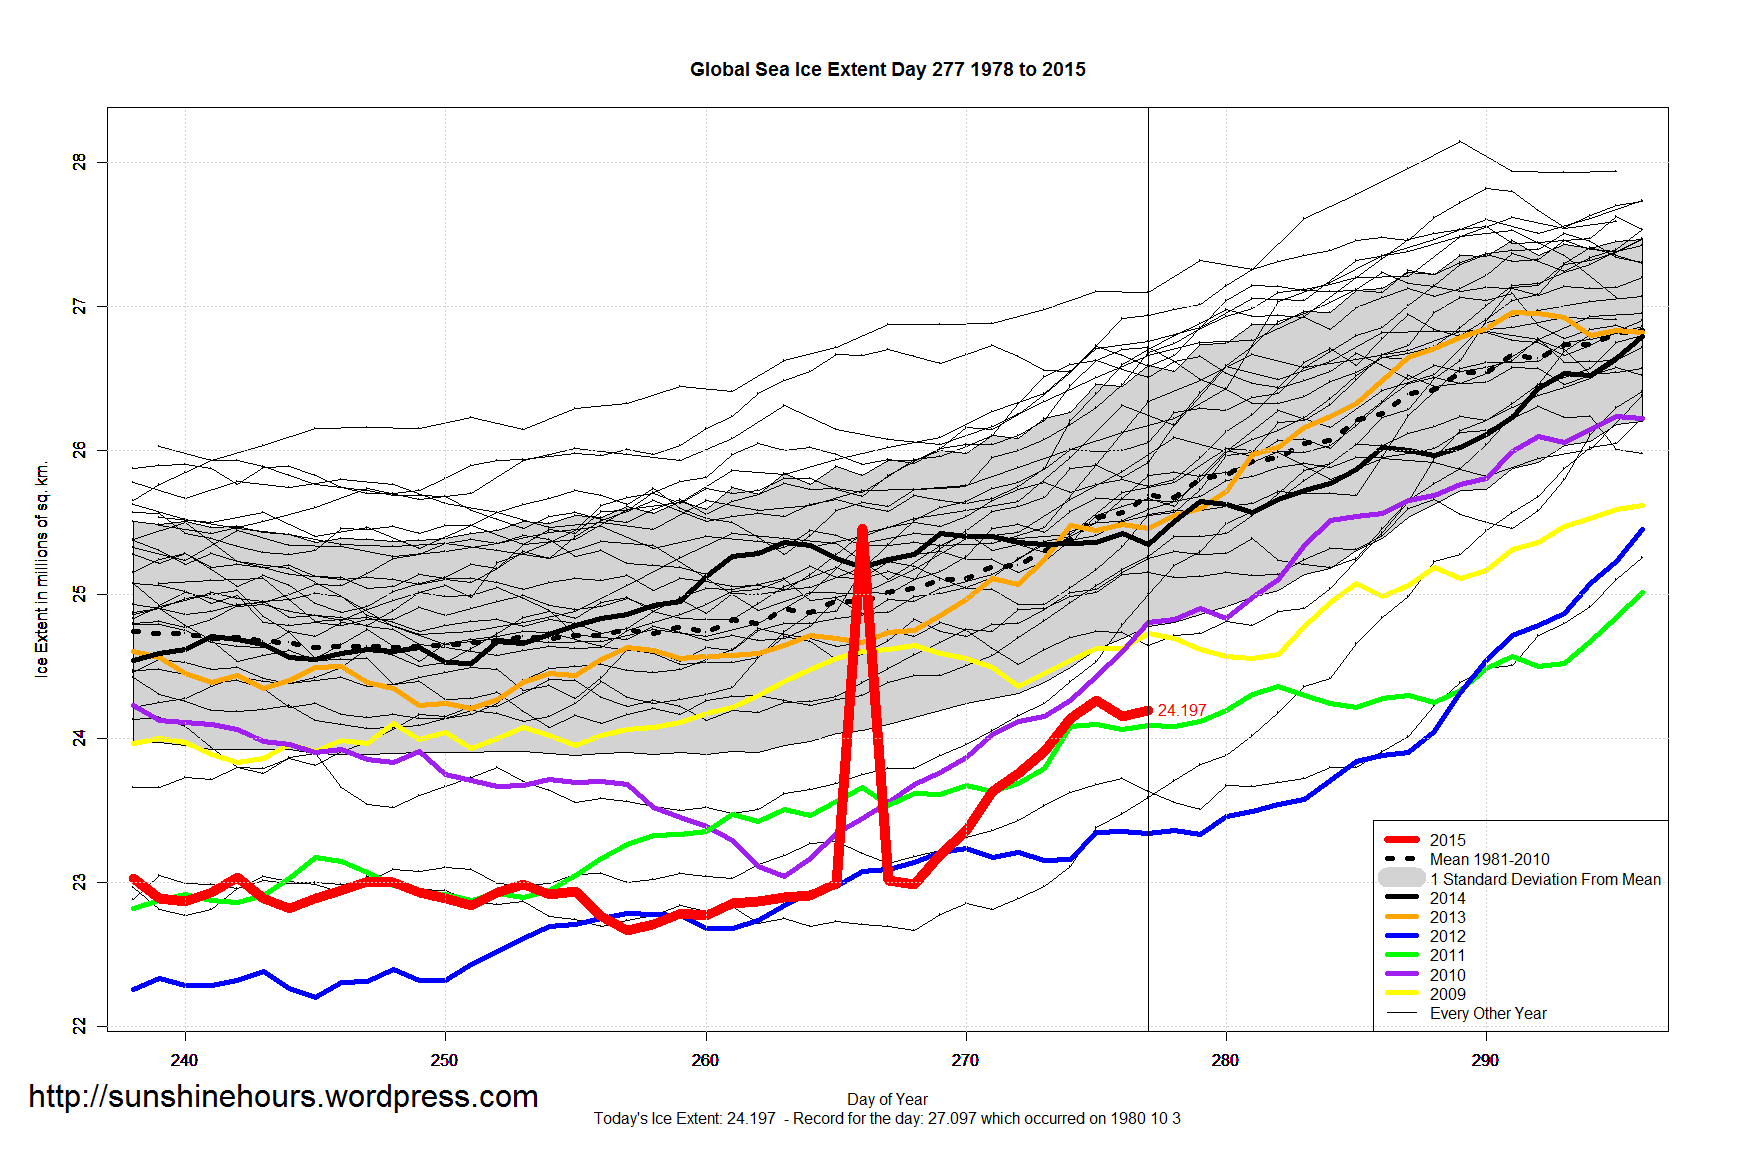
Do you feel that the data post-blip can be trusted? It is a significant upwards bump — from -1SD to +1SD — in a very short time frame. My suspicion is that a software glitch has not been fully rectified. Thoughts?
I just don’t know. The weird pattern was obliviously interpreted as ice, https://sunshinehours.files.wordpress.com/2015/09/capture.jpg