3 thoughts on “Sea Ice Extent (Global Antarctic and Arctic) – Day 331 – Trends From 2005”
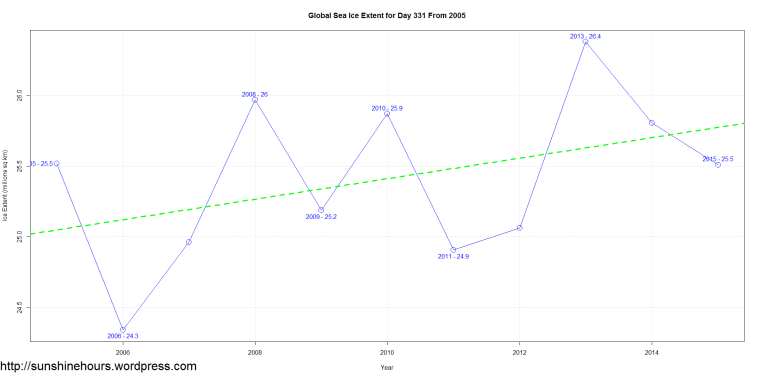
OK, so it may be difficult to project forward on just 10 years’ worth of data, but it’s a trend in the “correct” direction and – along with PIOMAS volume trends – one that defies explanation by the prevailing global warming alarmists. 25% of all anthropogenic CO2 has been emitted since 2000, yet we have volumes and extents both going up. Why?
Both polar regions have been cooling in recent years, as indicated by the ocean temperatures of the Arctic and Antarctic regions, but Antarctica’s temperatures a much more stable than the NP ones, Arctic:


OK, so it may be difficult to project forward on just 10 years’ worth of data, but it’s a trend in the “correct” direction and – along with PIOMAS volume trends – one that defies explanation by the prevailing global warming alarmists. 25% of all anthropogenic CO2 has been emitted since 2000, yet we have volumes and extents both going up. Why?
AMO most likely.
Both polar regions have been cooling in recent years, as indicated by the ocean temperatures of the Arctic and Antarctic regions, but Antarctica’s temperatures a much more stable than the NP ones,

Arctic:
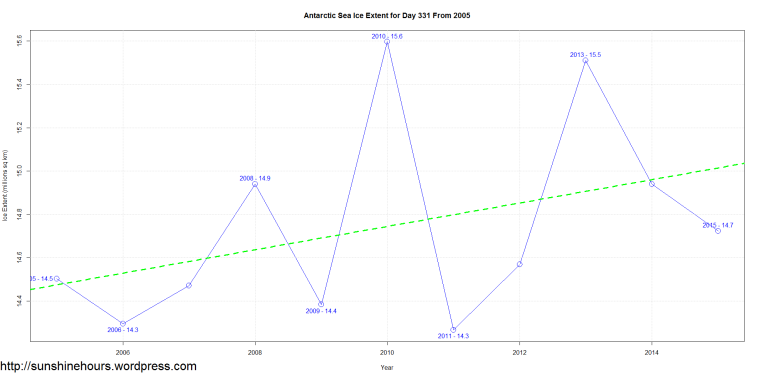
Antarctic:

source:
http://www.climate4you.com/SeaTemperatures.htm#Circum-arctic%20ocean%20temperatures%20from%20surface%20to%202000%20m%20depth